Configure integration with observability platforms and cloud storage
To support data ingestion and data output for your Grepr pipelines, you connect Grepr to external observability platforms and storage systems. To support these connections, the Grepr platform uses integrations. A Grepr integration provides the configuration details to connect to an external system, enabling data exchange between Grepr and that system.
After configuring an integration, you can use it in your Grepr pipelines to create sources to ingest data from agents and collectors, such as FluentD or the OpenTelemetry collector, and sinks to send data to an observability platform or storage.
You can use the Grepr UI or the REST API to create and manage integrations. To use the UI, see Manage integrations in the Grepr UI. To use the API, see the documentation for each supported integration.
Integration types
The Grepr platform includes two integration types:
- Observability platform integrations: Connections to monitoring, logging, and APM platforms, such as Datadog, Splunk, New Relic, and Sumo Logic.
- Cloud storage integrations: Connections to cloud storage. The Grepr data lake uses cloud storage to store your raw data and metadata.
Supported platform and storage integrations
The Grepr platform includes the following integrations. For details on configuring and using an integration, refer to the linked documentation page. For a complete list of supported integrations, supported functionality, and details on vendor-specific capabilities with some integrations, see Grepr supported integrations and regions.
Datadog
The Datadog integration supports connecting to Datadog and sourcing data from several Datadog-compatible collectors.
See Configure Datadog connections for integration with Grepr.
Splunk
The Splunk integration provides connectivity to Splunk through Splunk’s HTTP Event Collector (HEC) or S2S over HTTP. This integration supports reading data from Splunk collectors and writing data to Splunk indexes.
See Configure Splunk connections for integration with Grepr.
New Relic
The New Relic integration connects to New Relic’s observability platform. Use this integration to create sources that retrieve log data from New Relic collectors and sinks that send processed data to New Relic for monitoring and analysis.
See Configure New Relic connections for integration with Grepr.
Sumo Logic
The Sumo Logic integration connects to Sumo Logic’s cloud-based log management and monitoring platform using a Sumo Logic HTTP Source. You can use the integration to create sources that ingest data from Sumo Logic collectors and sinks that send processed data to Sumo Logic.
See Configure connections to Sumo Logic with Grepr integrations.
Grafana Cloud
You can configure Grepr’s OpenTelemetry integration to connect with Grafana Cloud using the OpenTelemetry Protocol (OTLP). Use an OpenTelemetry integration to create sources that ingest data from OTLP-compatible collectors and sinks that send processed log data to Grafana Cloud.
See Configure connections to Grafana Cloud with Grepr integrations.
Google Cloud Platform (GCP)
The GCP integration as a source enables you to stream logs from Google Cloud services to Grepr for processing and analysis, and then forward the processed logs to any sink created using a Grepr-supported integration, such as Datadog, Splunk, or New Relic.
See Google Cloud Platform observability with Grepr.
Cloud storage
The Grepr data lake uses Amazon S3 to store, manage, and support querying the raw data from your Grepr pipelines. Depending on your requirements, you can choose from two S3 integrations: a Grepr-hosted integration, which uses a Grepr-managed S3 bucket, and an integration that uses an S3 bucket in your account. Both integrations provide secure, managed, and efficient storage for your data, along with an optimized query interface.
To configure the Grepr-hosted integration, you only need to assign a name to the integration. The Grepr platform manages the S3 bucket, including its deployment and configuration.
Using the integration with your own S3 bucket requires that you deploy and configure an S3 bucket in your AWS account, but it provides more control over your data. See Host a Grepr data lake with the Amazon S3 integration.
Manage integrations in the Grepr UI
The Integrations page displays your integrations as cards, organized by observability vendor integrations and storage integrations. In each section, cards are ordered by recent activity, with the most active integrations appearing first.
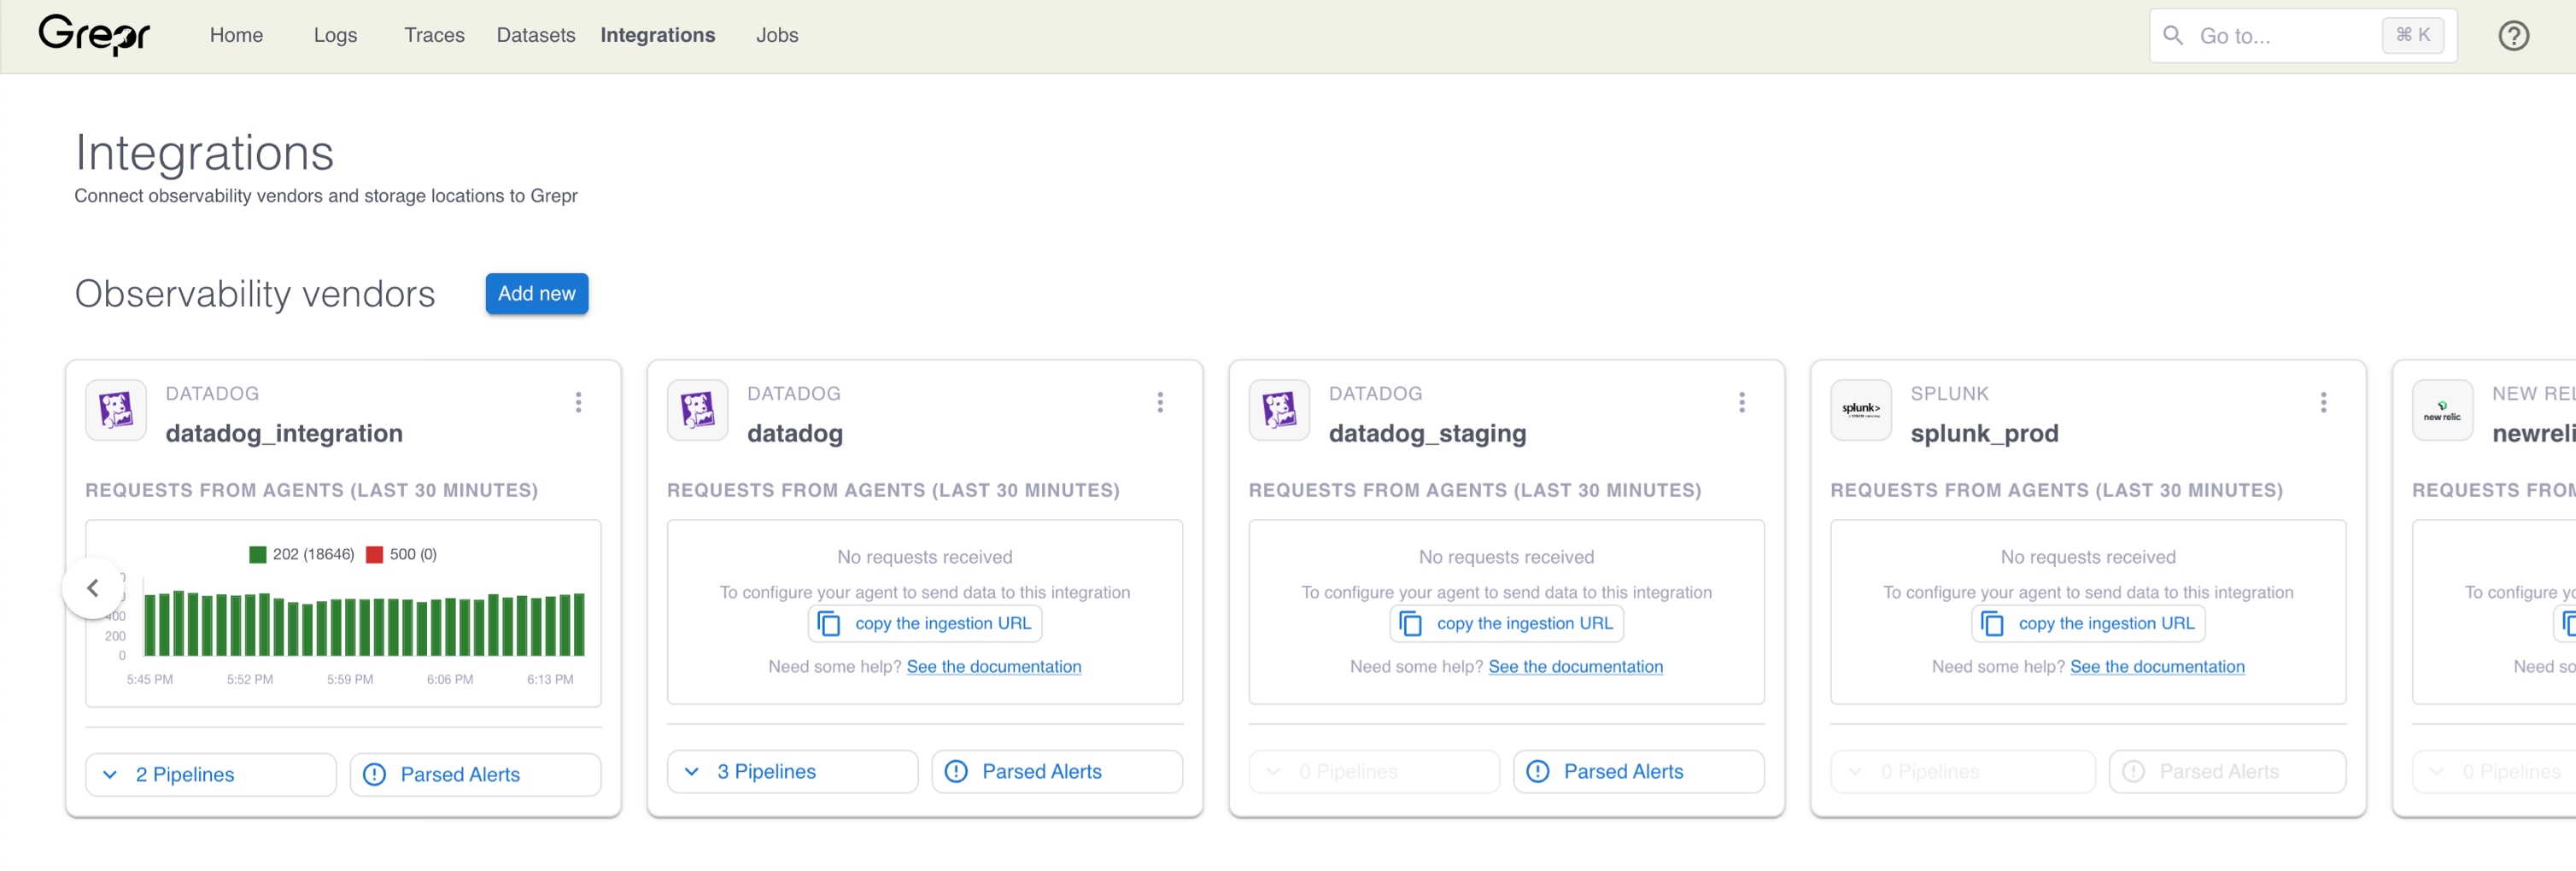
In addition to the integration name and its type, for example, a Datadog integration, if the integration is assigned to one or more teams, the team names appear in the header of the card.
You can get a visual overview of the health and usage of your integrations using the charts included on each integration card. If an integration has recent activity, such as requests received from agents by a vendor integration or the amount of data written to a storage integration, a time-series chart of that activity is shown on the card.
-
Observability vendor integrations display requests received from agents over the last 30 minutes, color-coded by HTTP status code.
- To view more detailed metrics or more details about a pipeline that uses the integration, select it from the Pipelines menu.
-
Storage integrations display data written to the integration over the last 24 hours, broken down by dataset.
- To view and query a dataset stored on a storage integration, select it from the Datasets menu.
To view more details about the metrics in either chart type, hover over any point in the chart to see a tooltip with the value and timestamp for that point.
Add an integration
To create an integration, click Add new next to the section heading for the type you want to add. To learn how to create and configure specific integrations, see the documentation for each supported integration.
Edit an integration
To edit an integration, click the three-dot menu on the integration card and select Edit. Update the fields in the dialog and click Save.
Delete an integration
To delete an integration, click the three-dot menu on the integration card and select Delete. Confirm the deletion in the dialog that appears.
Identify log events that should bypass aggregation
When you create an integration with an observability vendor that supports exception parsing, Grepr automatically parses queries used by monitors, dashboards, or alerts in your observability vendor platform. You can use this list of queries to identify log messages that should be treated as exceptions to log reduction in Grepr pipelines. In other words, messages that should bypass aggregation to ensure that critical alerts and dashboards continue to work as expected. To help with identifying exceptions, the Grepr UI displays a passthrough percentage estimate for each query. This estimate is the percentage of events, over a configurable time window, that would bypass aggregation.
You can also choose to automatically add and remove exceptions by enabling Auto-sync exceptions in your pipelines. To learn more about auto-sync and how aggregation exceptions are used in Grepr pipelines, see Skip aggregation for messages used in observability platform alerts.
If an integration does not support exception parsing, the Parsed Alerts button on the integration card is disabled. See Supported integrations: observability platforms.
To view the log queries parsed from an integration and configure passthrough estimation:
-
On the Integrations page, on the card for a vendor integration that supports query parsing, click Parsed Alerts.
The Parsed alert queries dialog displays a table with the following columns:
- Id: The unique identifier for this alert.
- Name: The alert or dashboard name from your vendor.
- Exception Type: The type of vendor resource the query came from, such as a monitor or dashboard widget.
- Query: The log query extracted from the alert or dashboard.
- Passthrough %: The percentage of raw logs in your configured dataset that match this query. Displaying this value requires that passthrough estimation is configured.
- Last Updated: When the passthrough percentage was last calculated. Hover over the value to see the exact date and time.
You can filter the table by name or query text and filter by exception type using the multi-select filter in the Exception Type column. To manage which columns are visible, click the Manage columns icon in the upper-right corner of the table.
-
To configure passthrough estimation and view the percentage of logs that would bypass aggregation for each query, click Configure Passthrough Estimation.
-
In the Dataset menu, select the dataset containing the raw logs to analyze. Grepr queries this dataset to calculate what percentage of logs match each alert query. Choose the dataset where the raw, unaggregated logs from this integration are stored.
-
Under Filter Query (Optional), select your preferred query syntax and enter a query to narrow down which logs Grepr analyzes. Use this field when your dataset contains logs from multiple sources, and you want Grepr to use only the logs relevant to this integration. Leave this field empty to include all logs in the dataset.
-
In the Lookback Duration menu, select the time window for calculating percentages. Options range from 15 minutes to 24 hours. A shorter window scans less data, reducing costs, but may not be representative if your log patterns vary throughout the day. A longer window provides more representative results but increases the cost of the analysis queries.
-
Click Save.
For the passthrough estimation configurations you create, the estimation process runs once every hour. Only queries that require calculating or recalculating, such as new or updated queries, are included in the estimation process. Typically, new or updated queries receive their first estimate within two hours, though this may take longer if a large number of exceptions are queued for processing.
To stop updating percentages and remove the configuration, click Delete in the configuration form.
Interpret passthrough percentages
Although two queries might use the same log events, their estimates will be equal. Additionally, the passthrough rate remains constant and is not the sum of the estimates. For example, if you enable exceptions for two queries that use the same log events, the passthrough rate doesn’t double, but remains equal to the rate if only one exception was enabled.
The Passthrough % value for a query shows what fraction of your raw logs that alert would require to pass through without aggregation. Use these values to evaluate the impact of adding each alert as a pipeline exception:
A percentage less than 1% is considered low, and an exception should have minimal impact on aggregation efficiency and storage.
You should review carefully any percentage above 1% before creating an exception for the query.
A dash (—) in the Passthrough % column indicates that no estimate is available yet, either because passthrough estimation is not configured, or because Grepr hasn’t finished calculating the estimate. If passthrough estimation is configured, estimates appear within 2 hours.
The Passthrough Estimation Configuration dialog also includes the Recent Activity table at the bottom. This section shows the most recent log events related to exception parsing, giving you visibility into recent integration activity without leaving the dialog. To view the complete log history for the integration, click View All Logs to go to the System Logs page, pre-filtered to show all activity for the selected integration.
Limitations
Grepr might split log events over 1MB, causing them to lose their original structured format. Each split event includes a common grepr.splitOriginId attribute if you need to reconstruct the original message.