Configure connections to Grafana Cloud with Grepr integrations
To connect Grepr to Grafana Cloud, use the Grepr OpenTelemetry integration to ingest logs into your Grepr pipelines for processing and send the processed logs to an OTLP endpoint in your Grafana Cloud account.
To send logs to a Grepr pipeline before forwarding them to Grafana Cloud, you change your collector configuration to send the logs to a Grepr endpoint URL instead of the Grafana Cloud OTLP endpoint. The Grepr OpenTelemetry integration supports several Grafana-compatible collectors, including the Grafana Alloy collector, the OpenTelemetry Collector, and Grafana Agent (EOL).
You can use the Grepr UI or REST API to create an OpenTelemetry integration configured for Grafana Cloud. To learn how to create an OpenTelemetry integration in the Grepr UI and configure collectors to send logs to Grepr, see Use an OpenTelemetry integration in a Grepr pipeline.
Although this page describes using an integration to create a pipeline for sourcing and sending data with a single observability platform, your pipelines can use multiple integrations to source and sink data for different platforms. For example, you can create a pipeline with a Datadog integration that’s used to source data from Datadog agents, and a Splunk integration and sink that sends the pipeline output to Splunk.
Requirements
To connect Grepr with Grafana Cloud using an OpenTelemetry integration, you need:
- A Grafana Cloud Access Policy token with write access to logs. See Grafana Cloud Access Policies .
- A Grafana Cloud OTLP Endpoint. See Send data to the Grafana Cloud OTLP endpoint .
Use an OpenTelemetry integration with Grafana in a Grepr pipeline
Step 1: Create an OpenTelemetry integration
To create an OpenTelemetry integration configured for Grafana Cloud in the Grepr UI:
-
Go to the Integrations page in the Grepr UI and click Add new next to Observability Vendors.
-
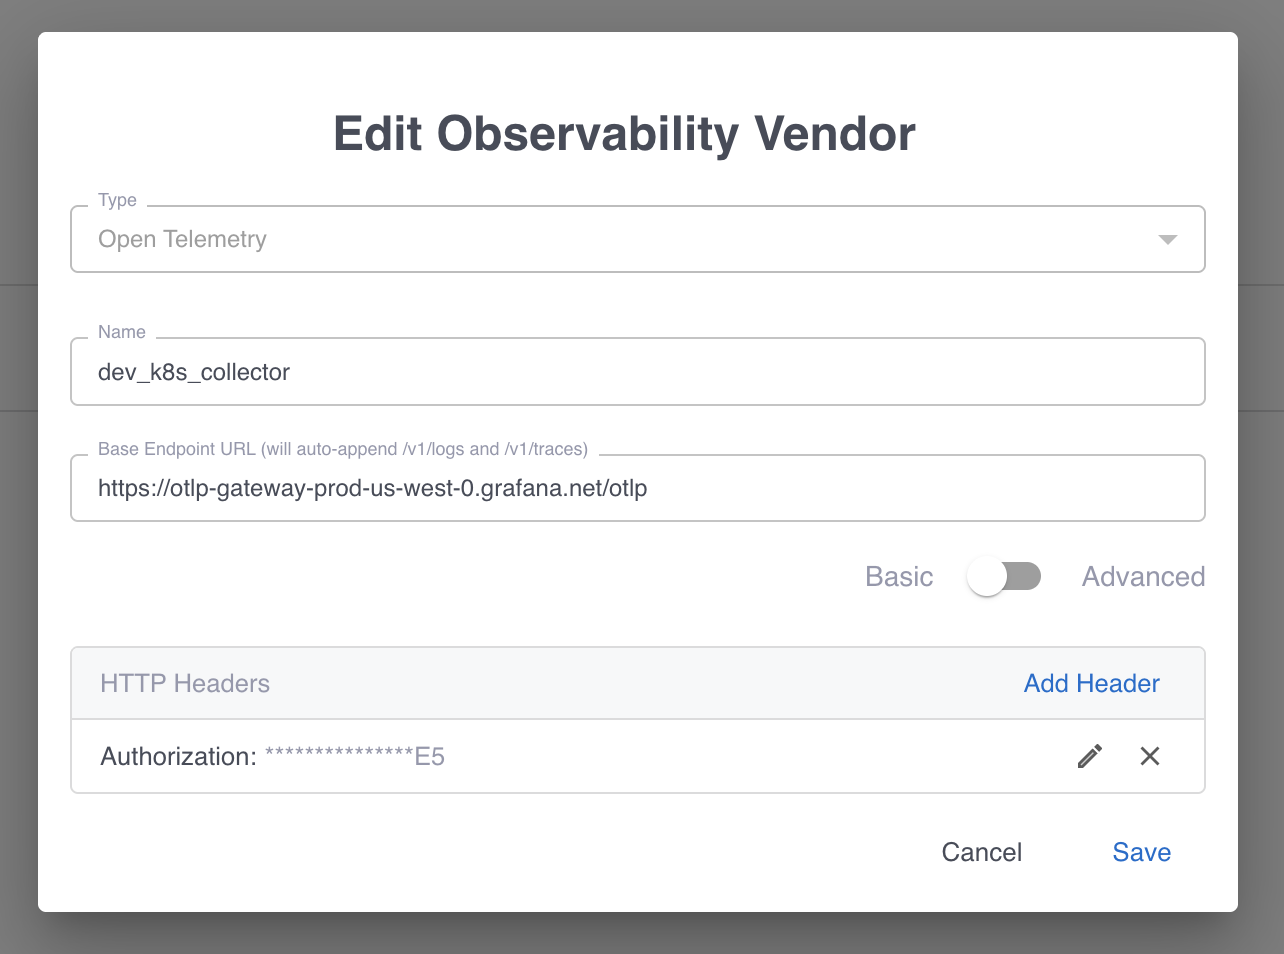
In the Add Observability Vendor dialog:
- In the Type menu, select Open Telemetry.
- In the Name field, enter a name for the integration. Grepr recommends naming it descriptively so it’s easy to identify. For example,
grafana-cloud-prod-logs. - In the Base Endpoint URL field, enter your Grafana Cloud OTLP endpoint URL.
- Click Add Header.
- In the Header Name field, enter
Authorization. - In the Header Value field, enter
Bearer <your-grafana-access-token>. Replace<your-grafana-access-token>with the token generated from your Grafana Cloud Access Policy. - Select the Make header secret checkbox.
- In the Header Name field, enter
-
Click Create.
-
Save the
GREPR TOKENdisplayed in the confirmation dialog securely.(Optional) Grant team access to the integration
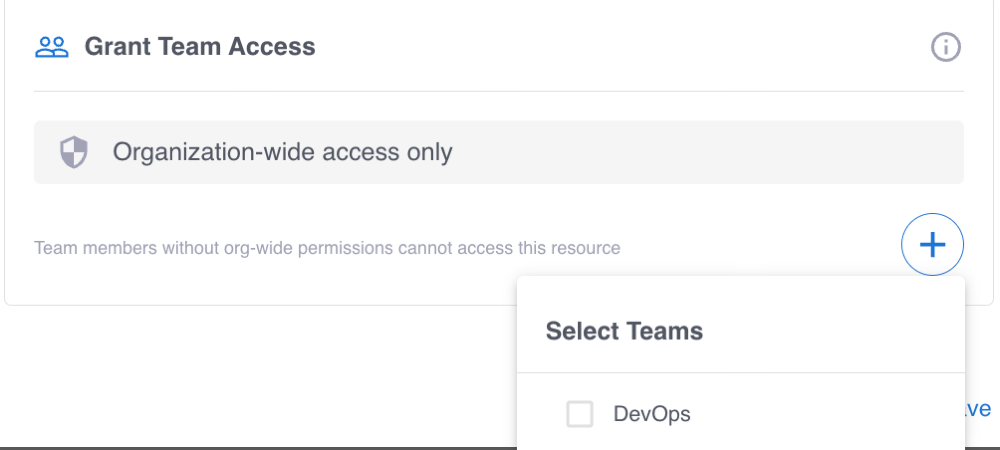
When you have teams in your Grepr organization, you can optionally grant access to the integration to one or more of those teams. To configure team access when you create an integration:
-
In the Grant Team Access card, click the plus sign icon (+).
-
Select the team or teams that should be granted access to the integration.
-
Click Create.
You can also add or remove teams when you edit the integration.
To learn more, see Manage teams in the Grepr platform and Permissions in the Grepr platform.
-
Step 2: Add a source to your pipeline
To add a source to your pipeline that uses the OpenTelemetry integration:
- In the Grepr UI, go to the details page of an existing pipeline or create a new pipeline from the homepage.
- In the left-hand navigation menu, click Sources.
- In the Add source dialog, select your OpenTelemetry integration in the Source menu.
- Click Submit.
Step 3: Configure log forwarding to Grepr
To send data to Grepr, you configure your collector or agent to send it to the ingestion URL for your Grepr integration, rather than to your observability vendor’s platform. To find the ingestion URL when using the Grepr UI to configure your pipeline, go to the details page for the pipeline, click Sources in the left pane, and copy the Ingest URL.
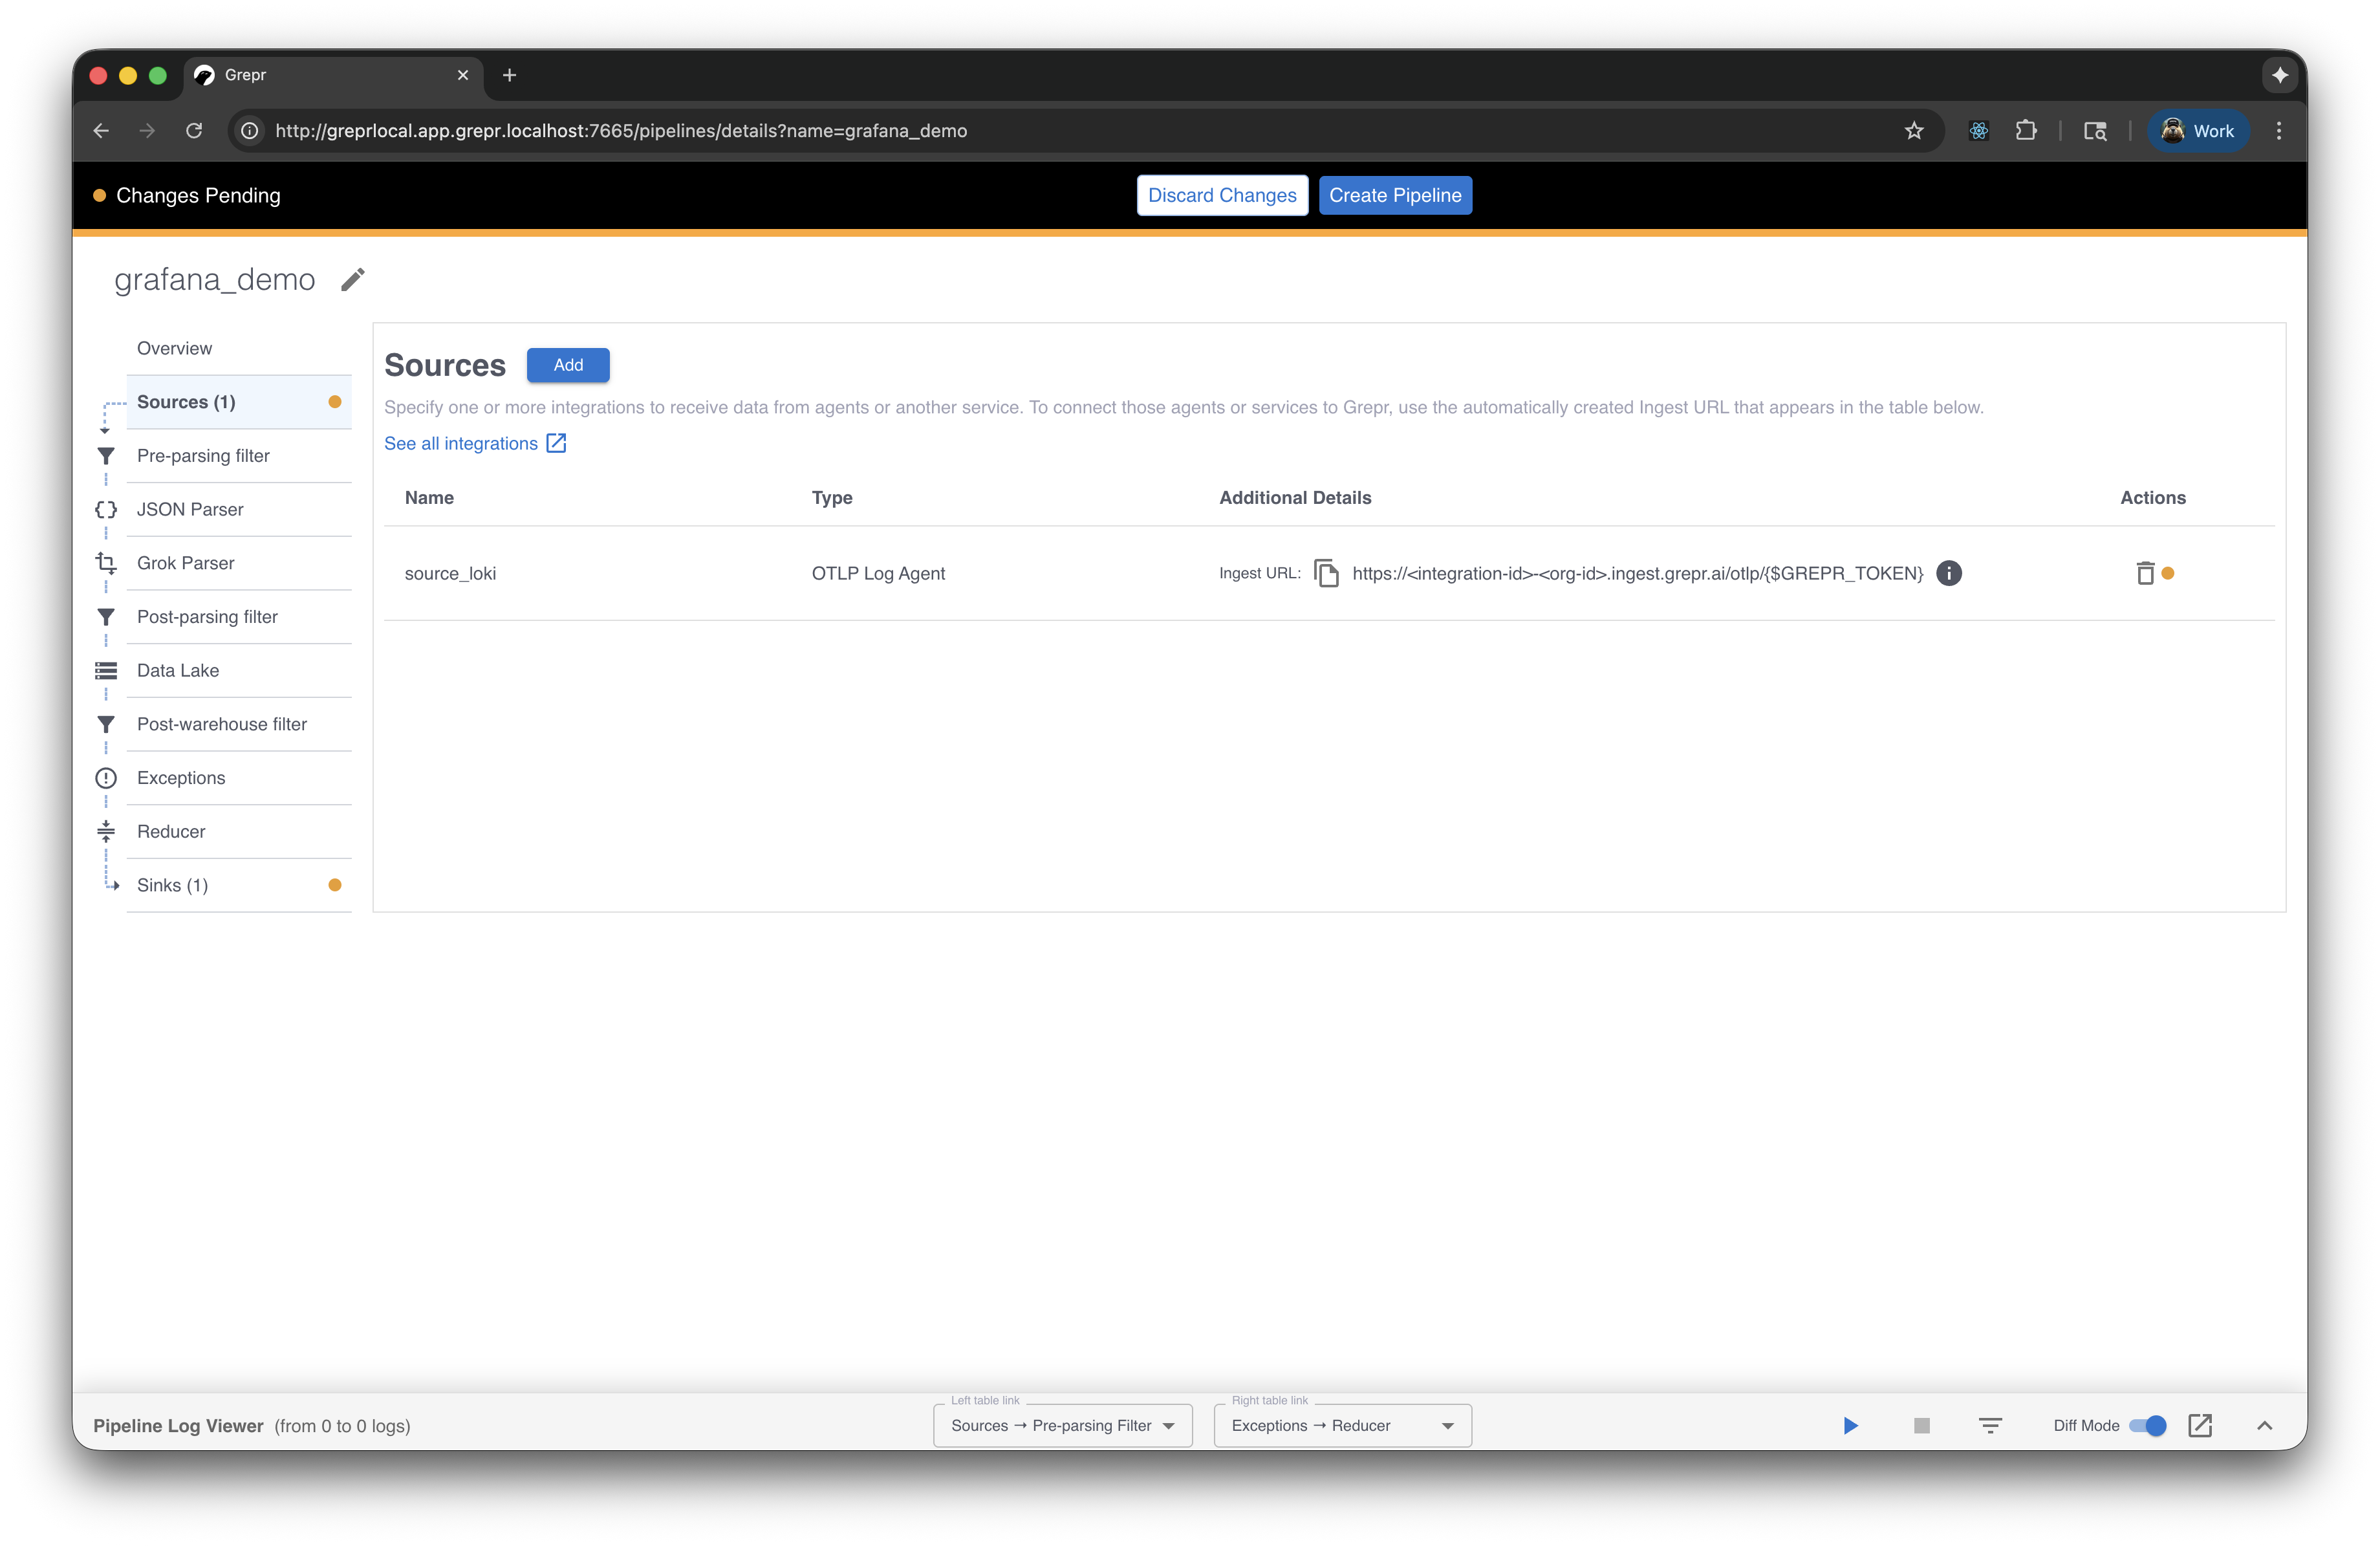
When you use the API, you can construct the ingestion URL using the following format:
https://<integration-id>-<org-id>.ingest.grepr.ai/otlp/<grepr-token>
Replace <integration-id> with the identifier of the vendor integration used by your pipeline and replace <org-id> with the identifier for your organization.
Although all sources created from the same integration share the same ingestion URL, you can use a single integration to create sources for multiple pipelines. The Grepr platform ensures events are routed to the correct pipelines.
Replace <grepr-token> with the token you saved after creating the OpenTelemetry integration in Step 1.
To see more information and configuration examples, select the tab for your preferred log collector:
Grafana Alloy
Grafana Alloy is the recommended collector for connecting to Grafana Cloud. It replaces the end-of-life Grafana Agent and provides enhanced performance and capabilities.
To configure Grafana Alloy to send logs to Grepr, use the OTLP exporter pointing to Grepr’s ingestion endpoint.
Configuration (config.alloy):
otelcol.exporter.otlphttp "grepr" {
  client {
    endpoint = "<ingestion-url>"
  }
}

otelcol.receiver.otlp "default" {
  http {}
  grpc {}

  output {
    logs = [otelcol.exporter.otlphttp.grepr.input]
  }
}
Replace <ingestion-url> with the full ingestion URL provided by the Grepr UI.
To configure dual shipping, create two exporters:
otelcol.exporter.otlphttp "grepr" {
  client {
    endpoint = "<ingestion-url>"
  }
}

otelcol.exporter.otlphttp "grafana" {
  client {
    endpoint = "<your-grafana-otlp-endpoint>"
    headers = {
      "Authorization" = "Bearer <your-grafana-access-token>"
    }
  }
}

otelcol.receiver.otlp "default" {
  http {}
  grpc {}

  output {
    logs    = [
      otelcol.exporter.otlphttp.grepr.input,
      otelcol.exporter.otlphttp.grafana.input
    ]
  }
}
Replace <your-grafana-otlp-endpoint> with your Grafana Cloud OTLP endpoint and <your-grafana-access-token> with your Grafana Cloud access token.
To learn more about Grafana Alloy configuration, see the Grafana Alloy documentation .
Advanced Configuration
Custom Headers
If your Grafana Cloud setup requires additional headers other than the Authorization header, you can add them in the Grepr UI when creating your OpenTelemetry integration:
- Non-secret headers: Add in the HTTP Headers section.
- Secret headers: Add in the HTTP Headers section and select the Make header secret checkbox.
Endpoint Overrides
For advanced use cases, you can use the Advanced mode in the Grepr UI to specify separate endpoints for logs and traces:
- Logs Endpoint Override: Specify a custom logs endpoint (if different from base endpoint +
/v1/logs). - Traces Endpoint Override: Specify a custom traces endpoint (if different from base endpoint +
/v1/traces).