View pipeline data flows and test changes with live edit
The Grepr live edit feature allows you to:
- Safely test changes to data transformations in a running production pipeline. Using live edit, you can make and test changes to the pipeline’s data processing and transformations without impacting the processing of live data and the flow of that data to your observability tools. After you’ve validated your changes, you can apply those changes to the production pipeline.
- See a live view of how data flows and is processed by the running production pipeline. You can use this capability to monitor the data flowing through your pipeline in real time, even if you’re not making changes to the pipeline.
The live edit feature works by creating a temporary copy of the current pipeline but excludes the sink, preventing duplicate data from being sent to your observability platform. Your changes run in the copy of the pipeline. The state of the data at each step of the copied pipeline can be seen in the live edit view. You can also use this view to compare the results of processing between the original and copy pipelines, allowing you to get fast feedback on your changes.
To ensure that the data passing through the pipeline copy doesn’t exceed the UI’s capacity, the pipeline copy receives a sampling of the pipeline data. To ensure the pipeline copy is receiving the data you need and the output data contains only the fields you need, you can use filter functionality in the live edit UI. See Create a subset of data for testing using filters.
Any changes you make that are not applied to the production pipeline are visible only in the pipeline copy, and no data is sent to configured sinks or data lakes. When your changes are tested and ready to apply to production, you can apply them to the original pipeline.
Using live edit with your pipelines
To use live edit:
-
In the Grepr UI, go to the overview page for your pipeline.
-
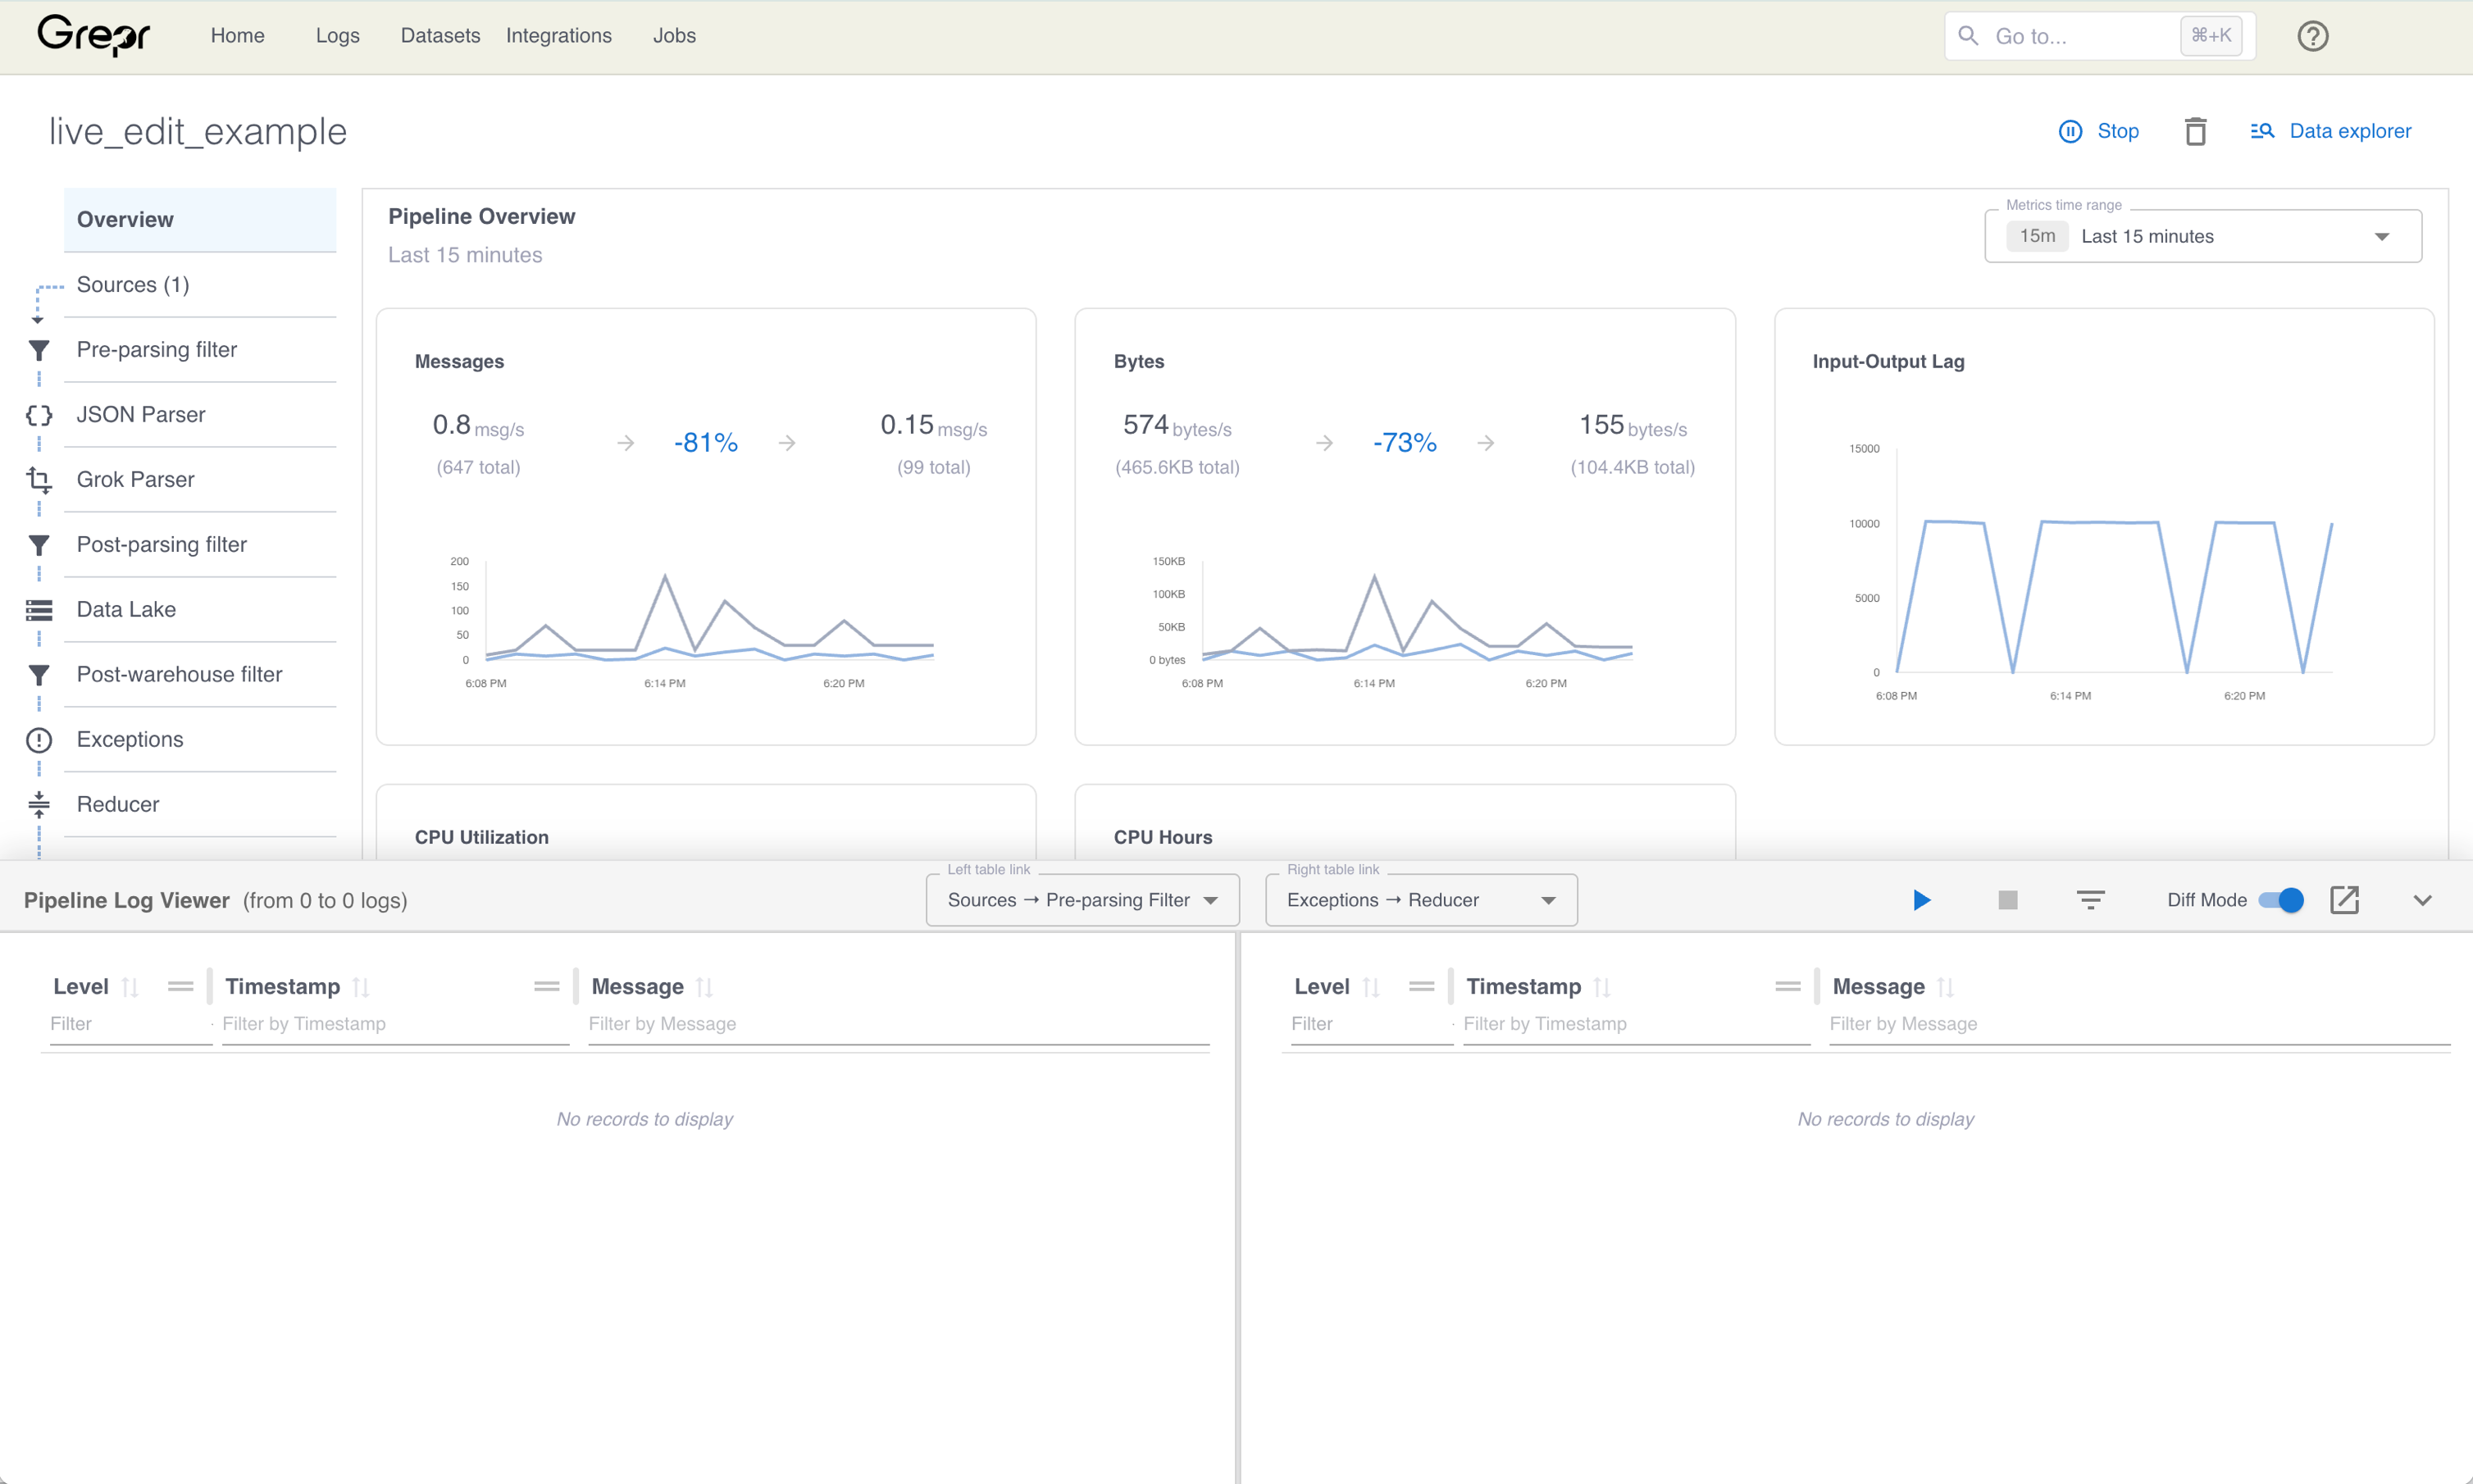
In the lower right corner of the page, click the expand icon to open the Pipeline Log Viewer.

-
To create and start a temporary copy of your pipeline, in the expanded Pipeline Log Viewer pane, click the play icon.
-
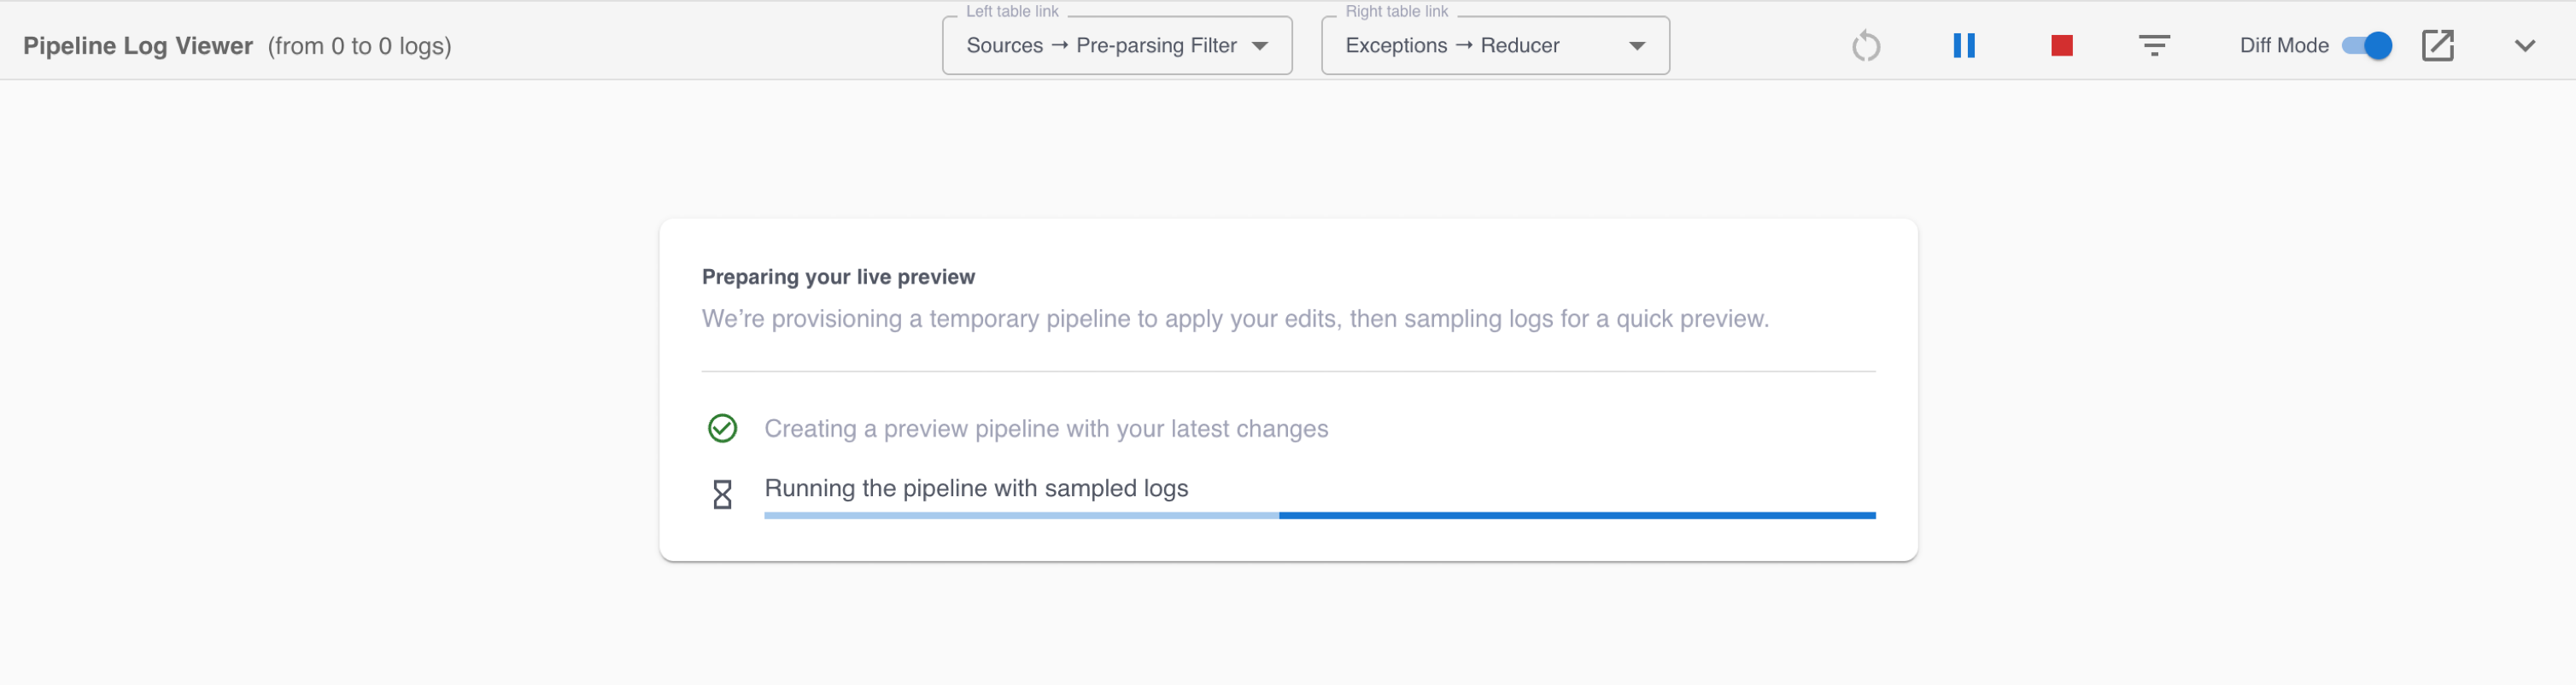
Grepr creates a temporary copy of your pipeline and runs it using log events sampled from the original pipeline’s source data. The Pipeline Log Viewer pane updates to show the status of the pipeline copy as it’s created and started.
-
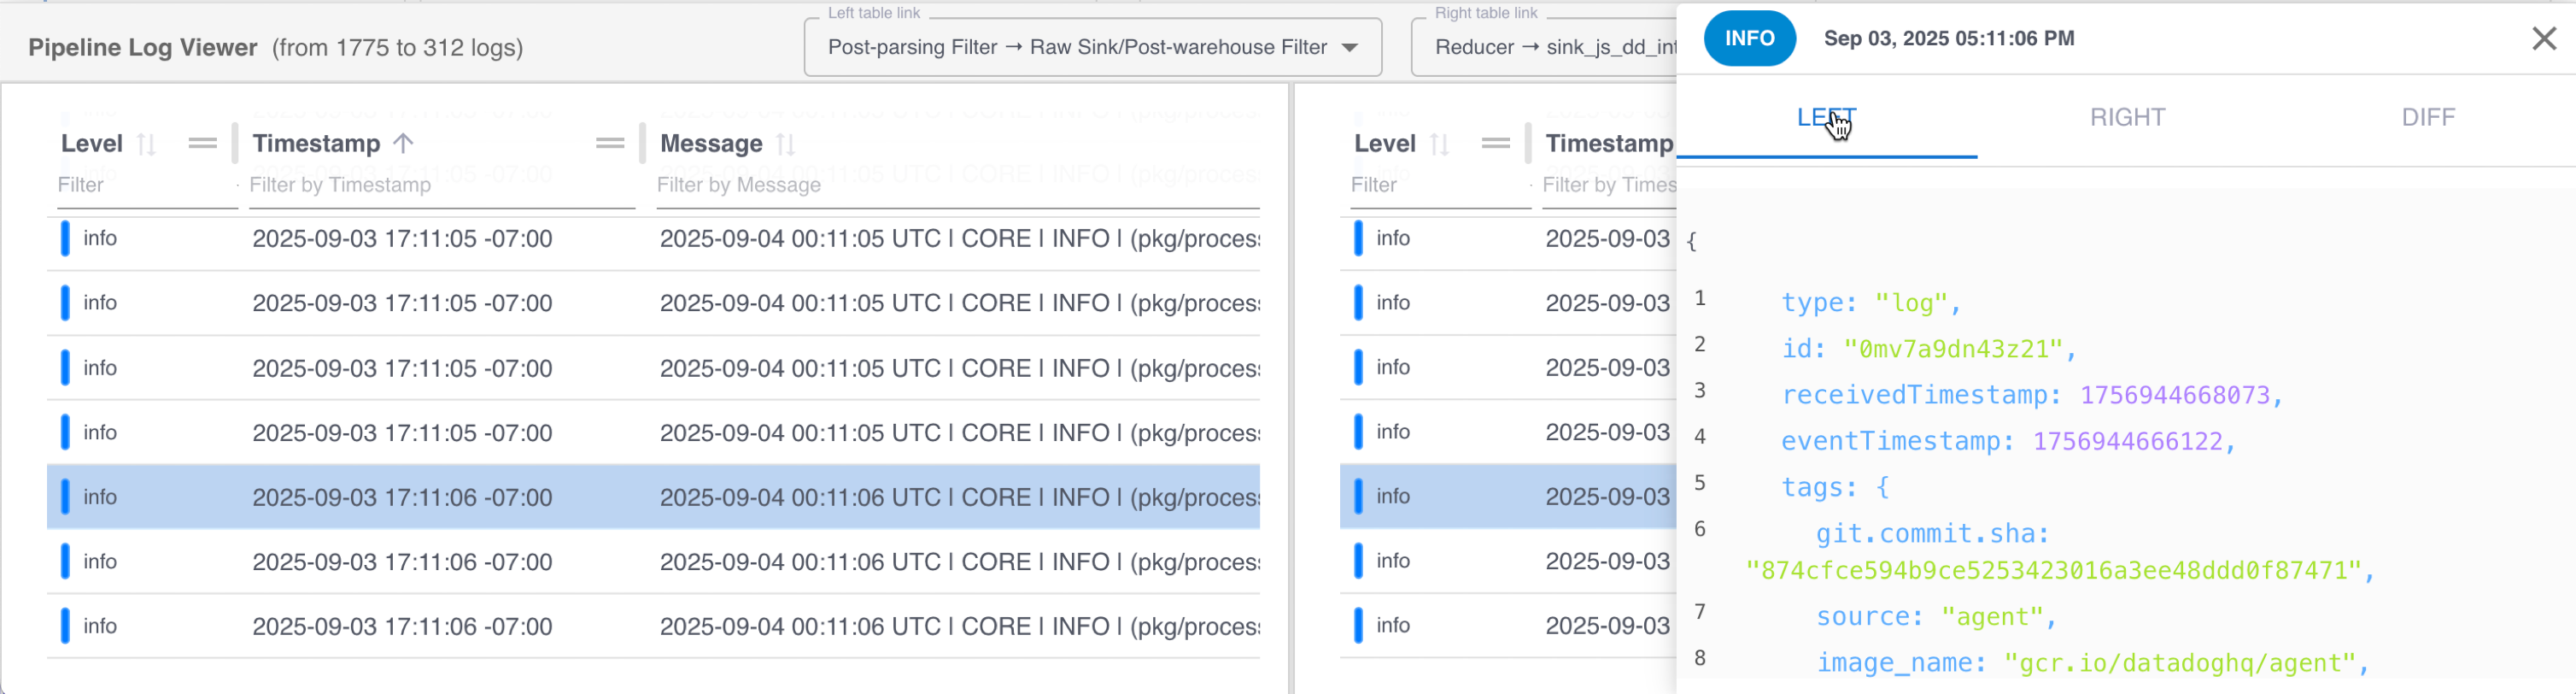
When the temporary pipeline copy is provisioned and started, the Pipeline Log Viewer pane displays the raw logs sampled from the original pipeline’s source data. You can use this view to examine logs at different stages of processing, and to test and validate changes to processing.
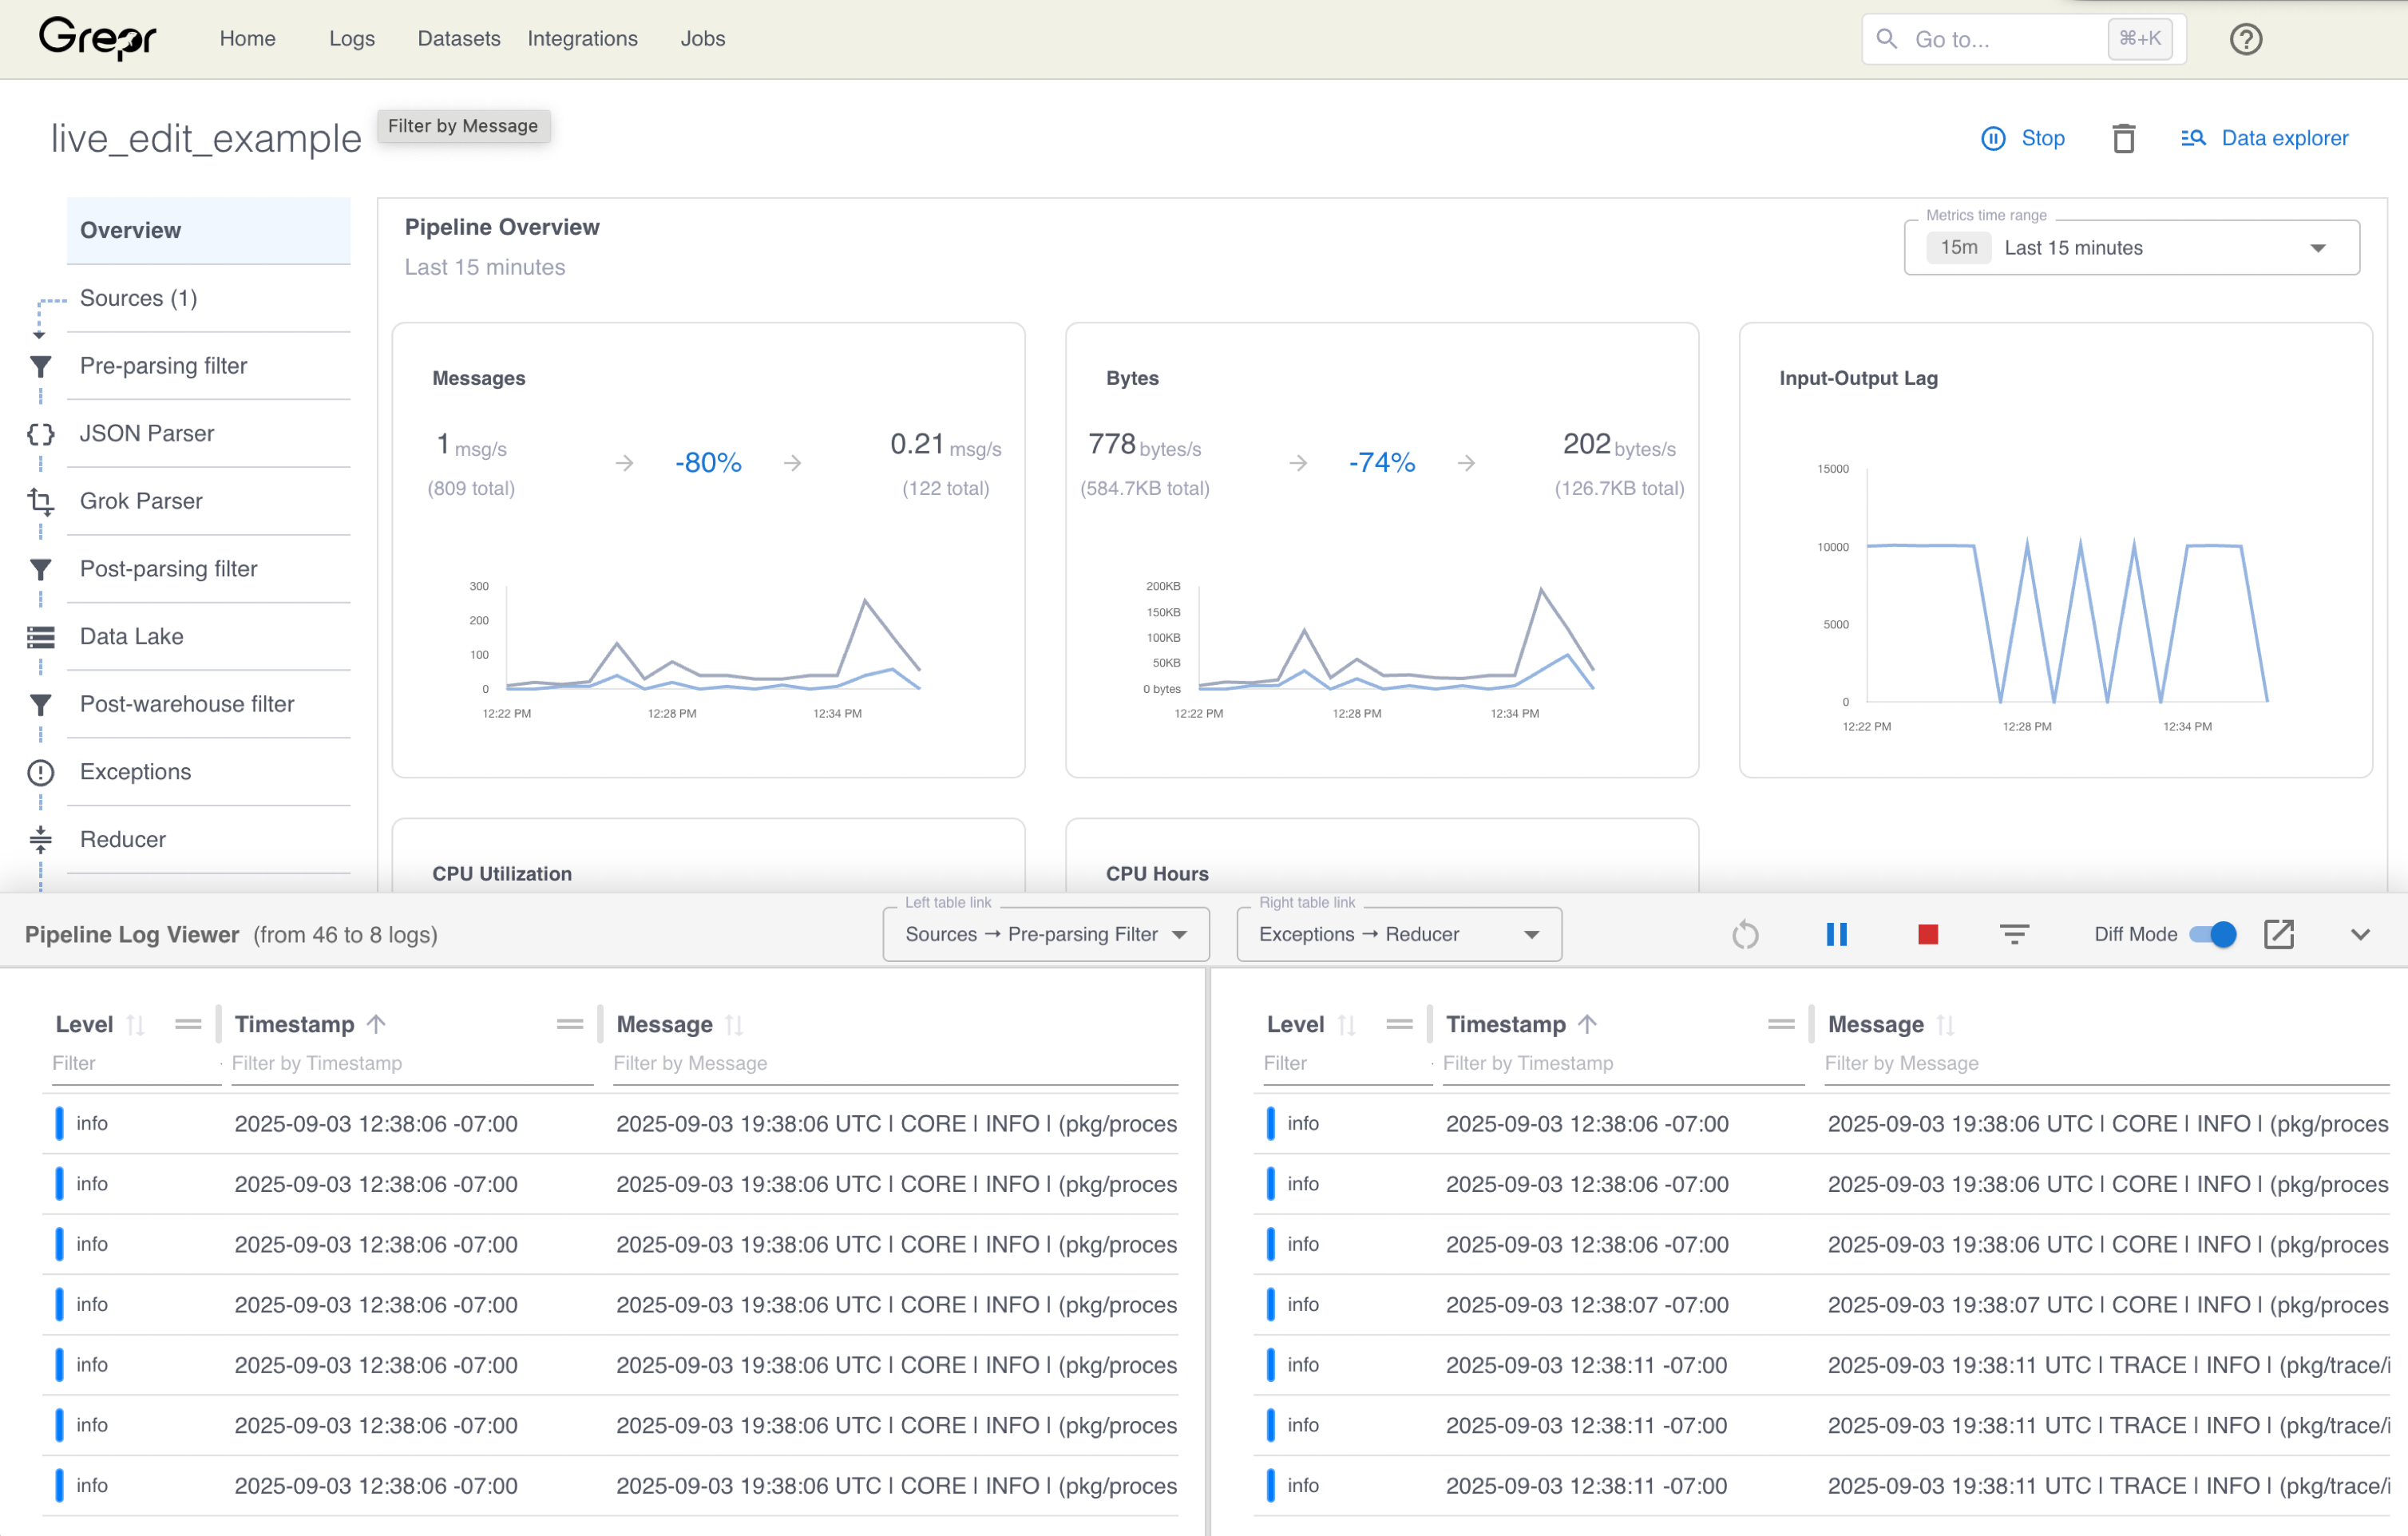
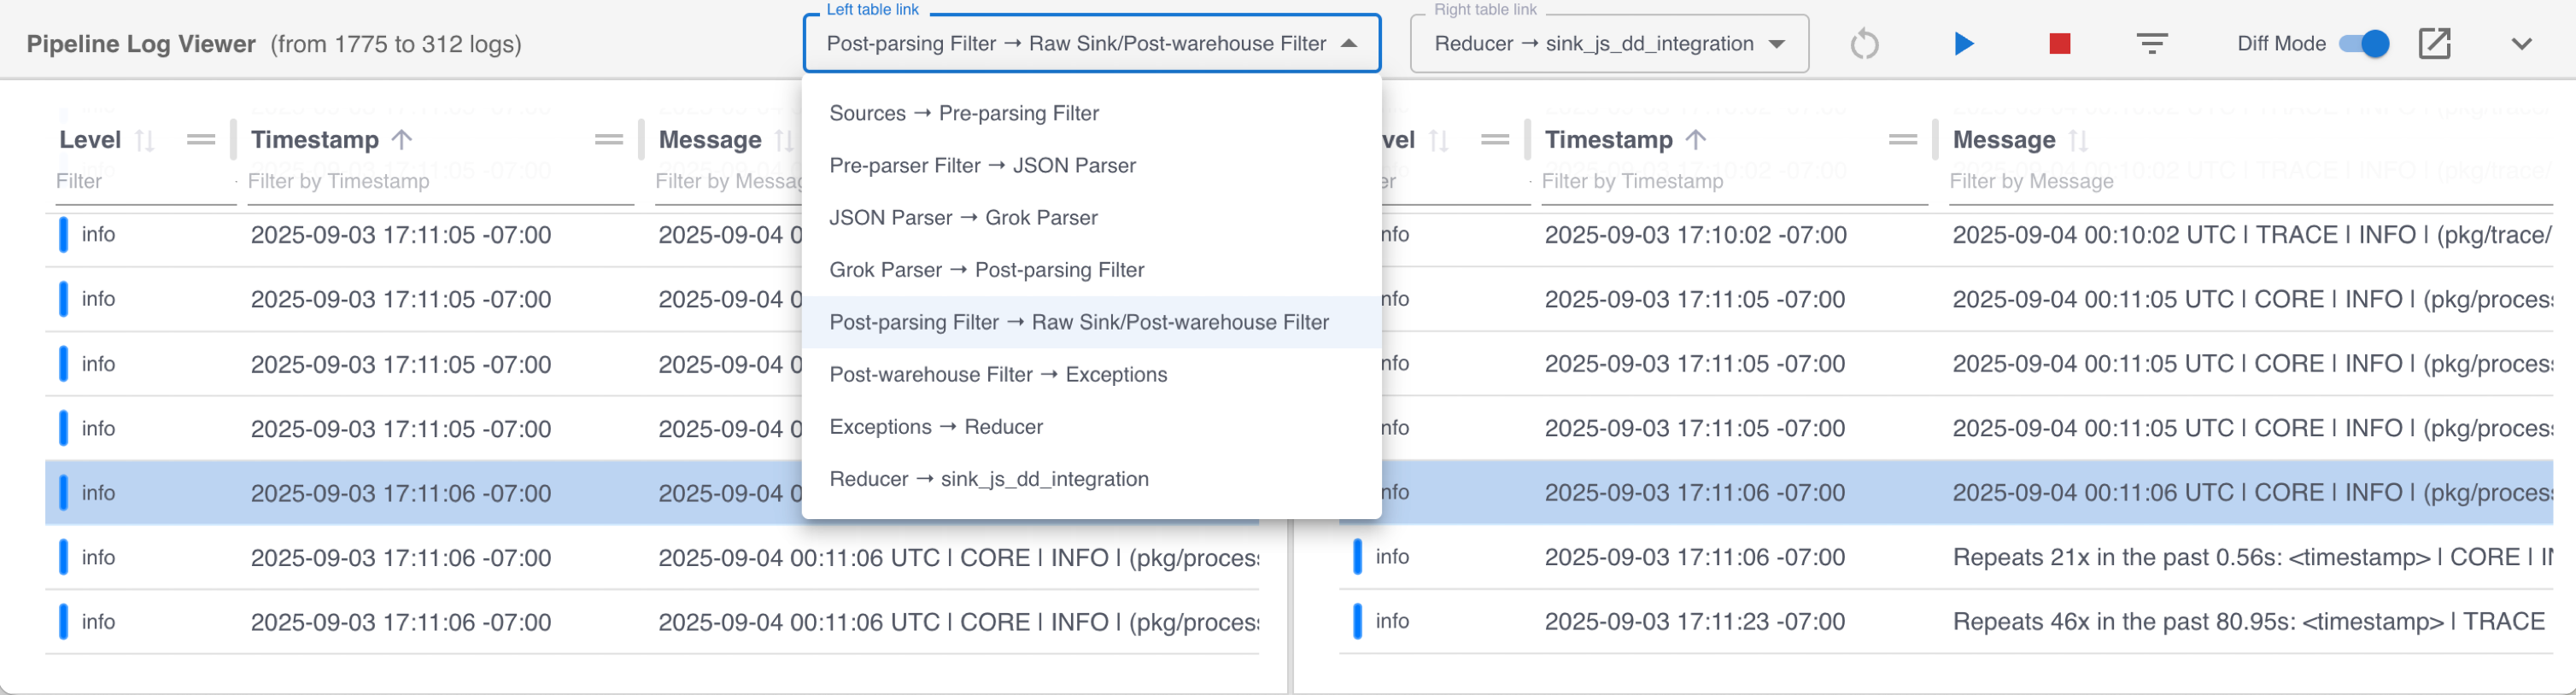
To examine logs at different stages of processing, use the Left table link or Right table link menus to select the stage of processing to view.
To view details of a log event, click the event in the Pipeline Log Viewer pane to open the log detail pane. The log detail pane displays the contents of the selected log event at the selected processing steps. The top bar of the log detail pane displays the event type, such as INFO, ERROR, or DEBUG, and the timestamp of the log message.
To view the state of the event in the selected processing step in the left table, click LEFT. To view the state of the event in the selected processing step in the right table, click RIGHT.
Click DIFF to view a JSON comparison of the event state in the left and right panels.
Create a subset of data for testing using filters
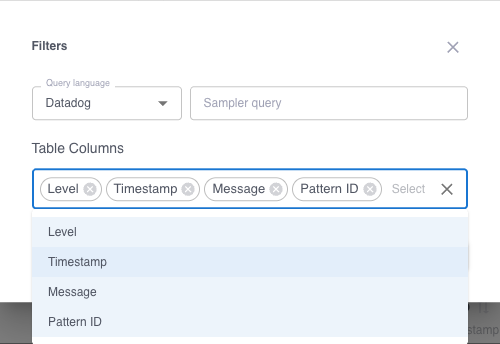
Because the pipeline copy is receiving a sampling of the source data to ensure that the UI’s capacity is not exceeded, the Pipeline Log Viewer supports functionality to filter source data. This filtering functionality ensures you get the correct data required for your testing. You can also use this feature to select specific columns to include in tables created from the filtered data.
To use the filter functionality, click the filter icon next to the stop icon. In the filter dialogue, select your preferred query syntax from the Query language menu, and enter your filter query in the Sampler query text box. To select the columns you want to see in a table created from the filtered data, add and remove column names in the Table Columns input.
Example: Use live edit to add and test a pipeline filter
- This example uses the pipeline created in the Build your first Grepr pipeline tutorial. If you want to follow the example, first complete that tutorial.
- Although this example uses Datadog, you can use the live edit feature with any Grepr-supported observability platform. For the complete list of supported observability vendors, see Supported integrations.
In this example, you use the following steps to test a filter that removes any log messages received by your Grepr pipeline that are assigned the hostname my-test-host-1.
- In the Grepr UI, go to the overview page for your running pipeline.
- In the left pane, click Pre-parsing filter to open the filter configuration, and click Add next to Filters.
- Make sure Query language is set to Datadog, and enter the following expression in the Query field:
-host:my-test-host-1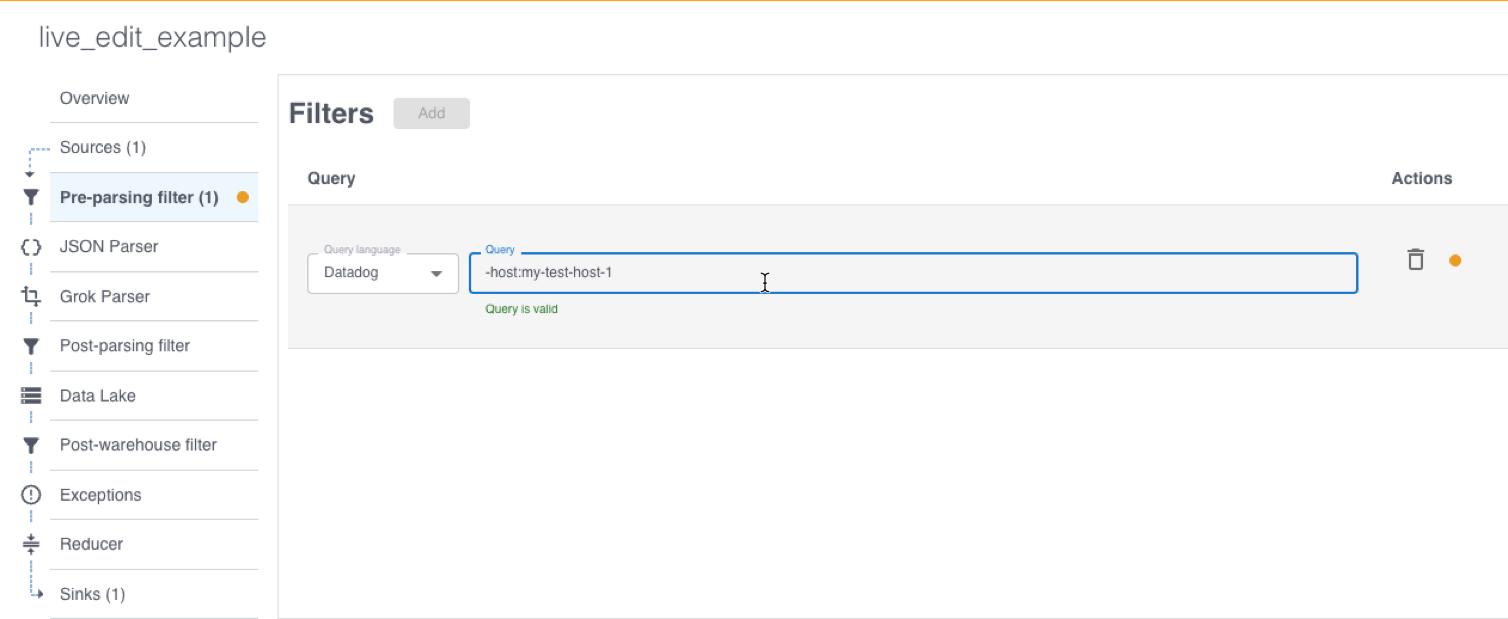
-
Do not click Apply Changes. Before applying the changes to the production pipeline, use the live edit feature to test and validate the filter.
-
In the lower right corner of the page, click the expand icon to open the Pipeline Log Viewer and click the play icon to create and start a temporary copy of your pipeline with the filter added.
-
In the Pipeline Log Viewer left table, click a log message from
my-test-host-1. The log detail pane opens. Because the filter removes the log messages from the pipeline, only the LEFT table view is displayed.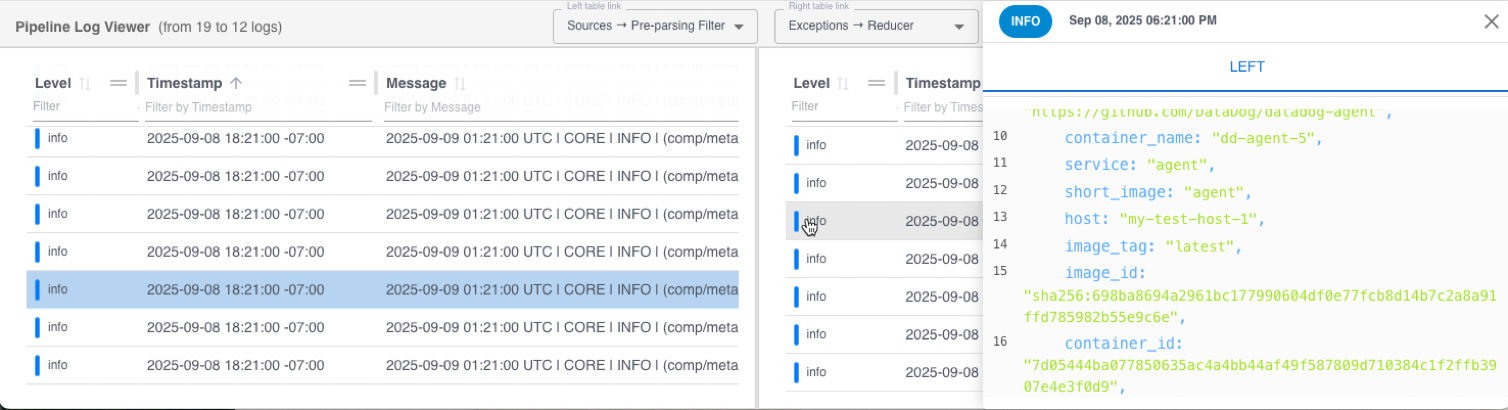
-
When you complete validation of your change, click Apply Changes to save the new configuration to the production pipeline.