Tutorial: Build your first Grepr pipeline
This tutorial is an end-to-end example that shows you how Grepr dynamically reduces the volume of shipped logs without losing data. It does this by walking you through an example that integrates Grepr with Datadog, creates a Grepr pipeline that processes log events forwarded from Datadog agents, and sends the resulting events to Datadog.
In this tutorial, you:
- Verify that you can directly send log events from your local environment to Datadog.
- Configure a Grepr integration with Datadog.
- Configure a Grepr storage integration to store raw logs in the Grepr data lake.
- Create a Grepr pipeline that processes raw logs and sends the resulting processed events to Datadog.
- Use Docker to simulate multiple hosts sending log events to Grepr by running multiple Datadog agents in your local environment.
- Run the pipeline and view the output in the Grepr and Datadog UIs.
- This tutorial uses Datadog as the observability tool. However, you can use this tutorial to create a pipeline that integrates with any Grepr-supported observability tool. For the complete list of supported observability vendors, see Grepr supported vendor and storage integrations.
- To show you the most direct way to create a pipeline in the Grepr UI, this tutorial walks you through creating an end-to-end pipeline directly in the Grepr pipeline editor. However, to give you more control over configurations, the Grepr UI also includes separate interfaces to configure pipeline components such as integrations.
- This tutorial shows you how to send logs to Grepr using Datadog agents running in local Docker containers. However, if you have existing infrastructure forwarding logs to Datadog, you can use that infrastructure for this example. The Grepr Datadog integration also supports log collectors other than Datadog agents. To learn more about supported collectors, including configuration details, see Configure Datadog connections with a Grepr integration.
Requirements
To complete this tutorial, you must have:
- A Grepr account and a login to your organization’s Grepr UI. If you don’t have a Grepr account, sign up at https://app.grepr.ai/signup .
- An organization identifier. A 3–31 character identifier containing only lowercase letters, numbers, and hyphens. If you don’t have one, create an organization ID when you sign up for a Grepr account.
- An account with an observability vendor supported by Grepr. This tutorial uses Datadog. If you don’t have a Datadog account, you can sign up for a free trial at www.datadoghq.com . For the complete list of supported observability vendors, see Grepr supported vendor and storage integrations.
- A Datadog API key for your account. You can retrieve this from your Datadog Organization Settings or copy it from the Agent Setup page instructions.
- The Datadog site parameter that the Datadog agents should use. This parameter is determined by the Datadog site you selected. For example, if you select
US1, the site parameter’s value isdatadoghq.com. - A Docker installation in your local environment. Docker is used to run the Datadog agents that send log events to Grepr.
Step 1: Verify that agents can send events to Datadog
Before working through this tutorial, you should verify that Datadog agents running in your local environment can send log events directly to Datadog. In a terminal window, run the following command, replacing DD_API_KEY_VALUE with your Datadog API key and DD_SITE_VALUE with your Datadog site parameter. Optionally replace DD_HOSTNAME with a preferred hostname for testing. This value can be used in the Datadog UI to filter incoming log events:
docker run --rm --name dd-agent \
-e DD_API_KEY=DD_API_KEY_VALUE \
-e DD_SITE="datadoghq.com" \
-e DD_LOGS_ENABLED=true \
-e DD_LOGS_CONFIG_CONTAINER_COLLECT_ALL=true \
-e DD_HOSTNAME=my-test-host \
-v /var/run/docker.sock:/var/run/docker.sock:ro \
-v /proc/:/host/proc/:ro \
-v /sys/fs/cgroup/:/host/sys/fs/cgroup:ro \
gcr.io/datadoghq/agent:latest
While this command runs, go to the Datadog UI, click Logs, and then click Live Tail. If everything’s working correctly, you see log events arriving from the Datadog agent.
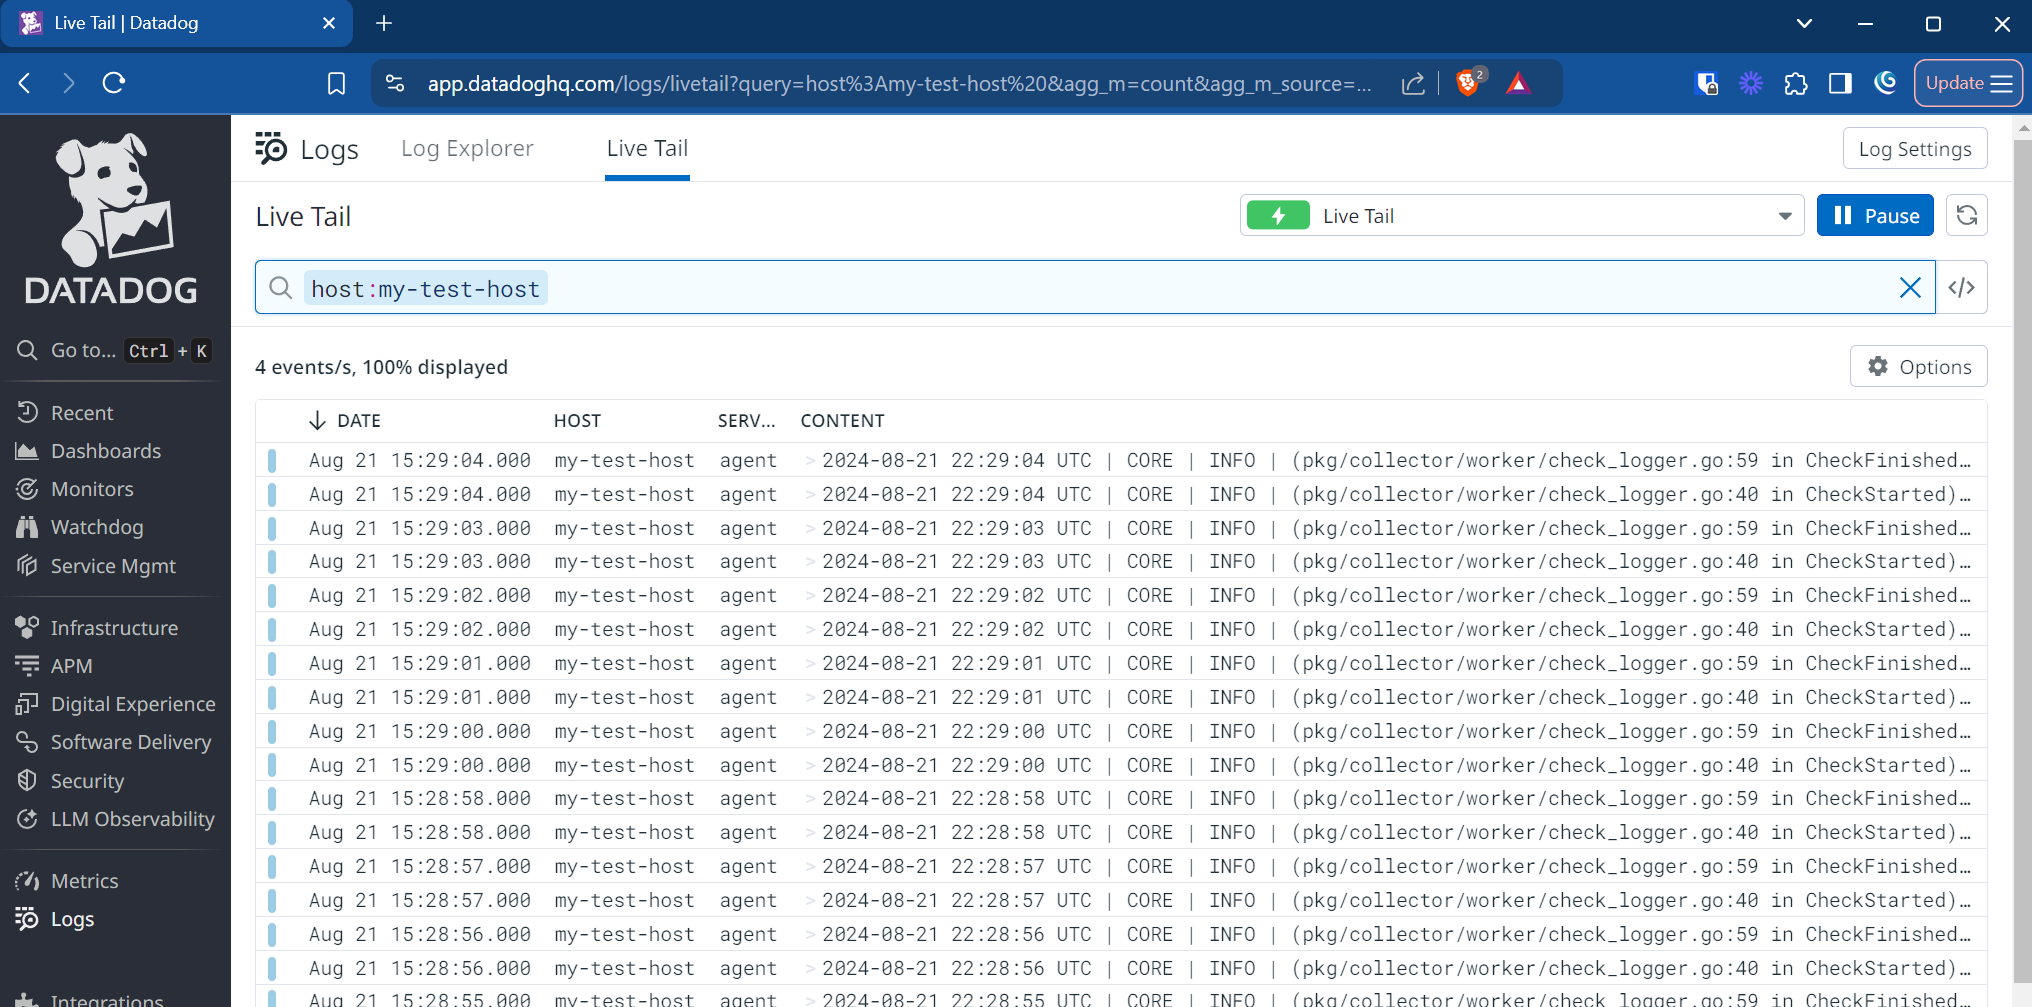
To learn more about the Datadog Docker Agent, including details for the configuration options, see the Datadog documentation .
When you’ve finished testing, shut down the agent by running the following command in a separate terminal:
docker stop dd-agentStep 2: Create a Grepr pipeline to process log events
A Grepr pipeline defines the steps to process log data. Pipelines you create in the Grepr UI implement a flow with the following steps to reduce the volume of log data sent to your observability platform:
- Read logs from one or more sources. Sources use Grepr integrations that connect Grepr to external systems, such as observability vendors or cloud storage providers. This tutorial guides you through creating a source that uses a Grepr Datadog integration.
- Filter log events at several stages in the pipeline.
- Extract structured data from unstructured log messages or attributes using the Grepr Grok parser. See the Grok parser documentation.
- Persist the raw logs into your Grepr data lake. To add a data lake in the pipeline editor, you must have a Grepr storage integration and a Grepr dataset configured.
- The storage integration is used to ensure retention of all data by storing raw logs in low-cost cloud storage. This tutorial uses a storage integration that uses a Grepr-hosted Amazon S3 bucket.
- The dataset defines a namespace in your storage specifying where the raw logs are stored.
- Reduce the amount of log data to forward to your observability platform through the log reducer. To learn more about the log reducer, see Reduce shipped data volumes with the Grepr log reducer.
- Send the result of processing the logs to one or more sinks. Like sources, sinks use a configured Grepr integration.
To create pipelines with more complex functionality, you can use the Grepr REST API. See the Job creation API guide.
To create a new pipeline:
-
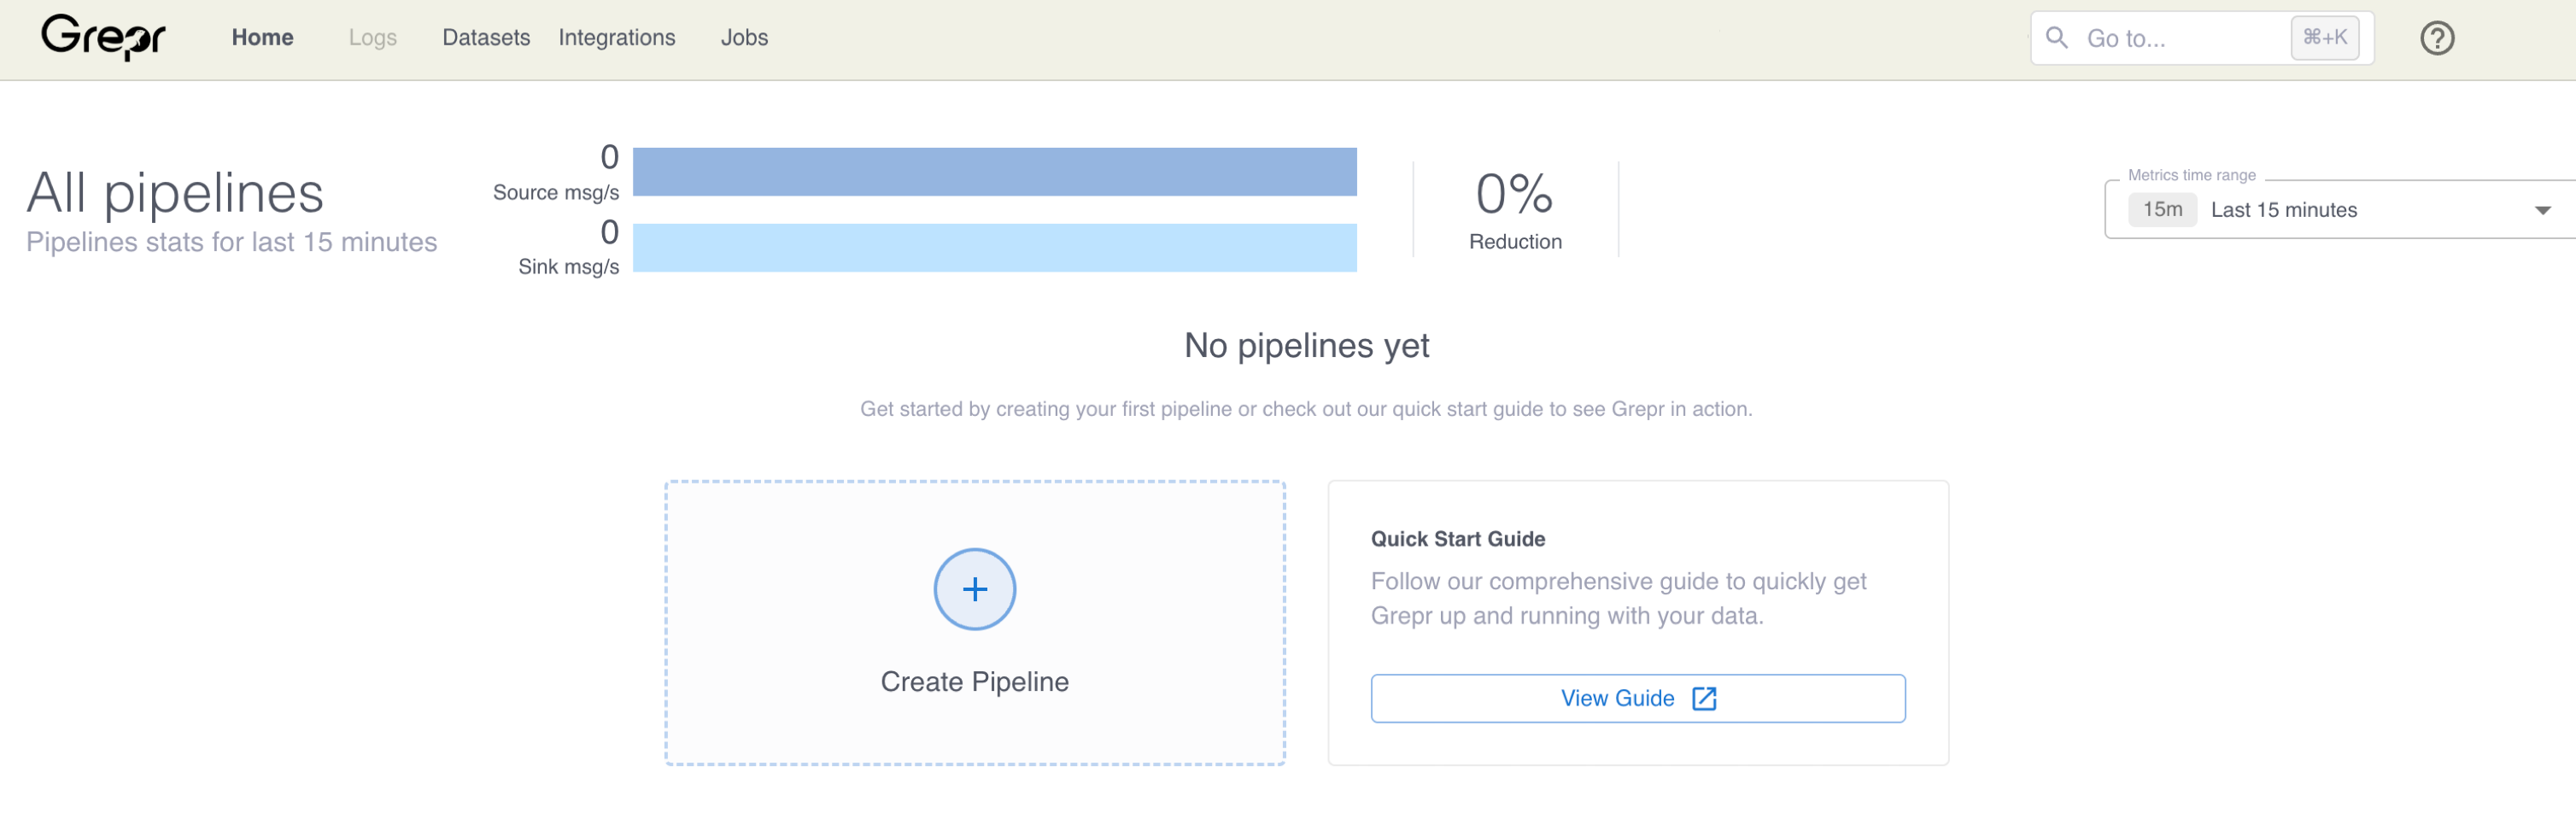
In the Grepr UI, click Home in the navigation menu, then click Create Pipeline.
-
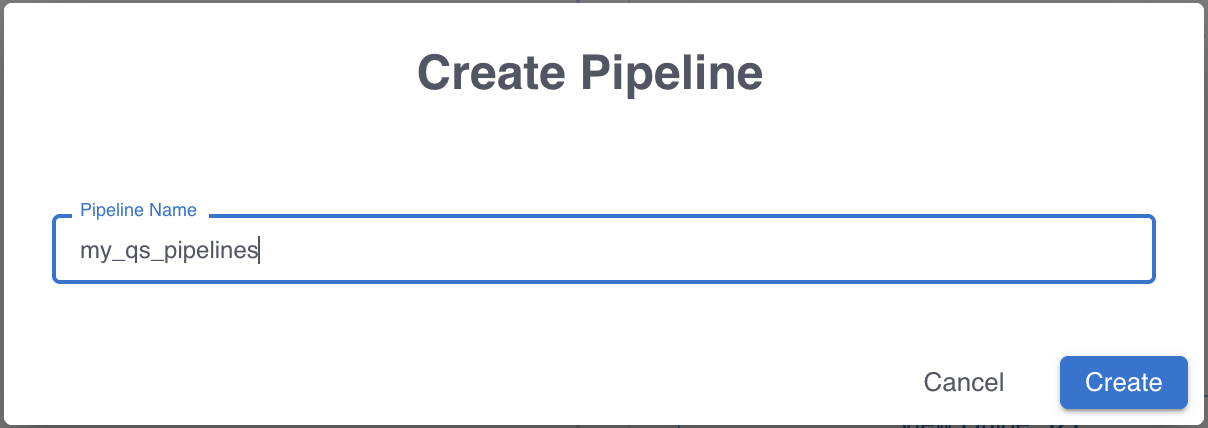
In the Create Pipeline dialog, enter a name for your new pipeline.
-
Click Create.
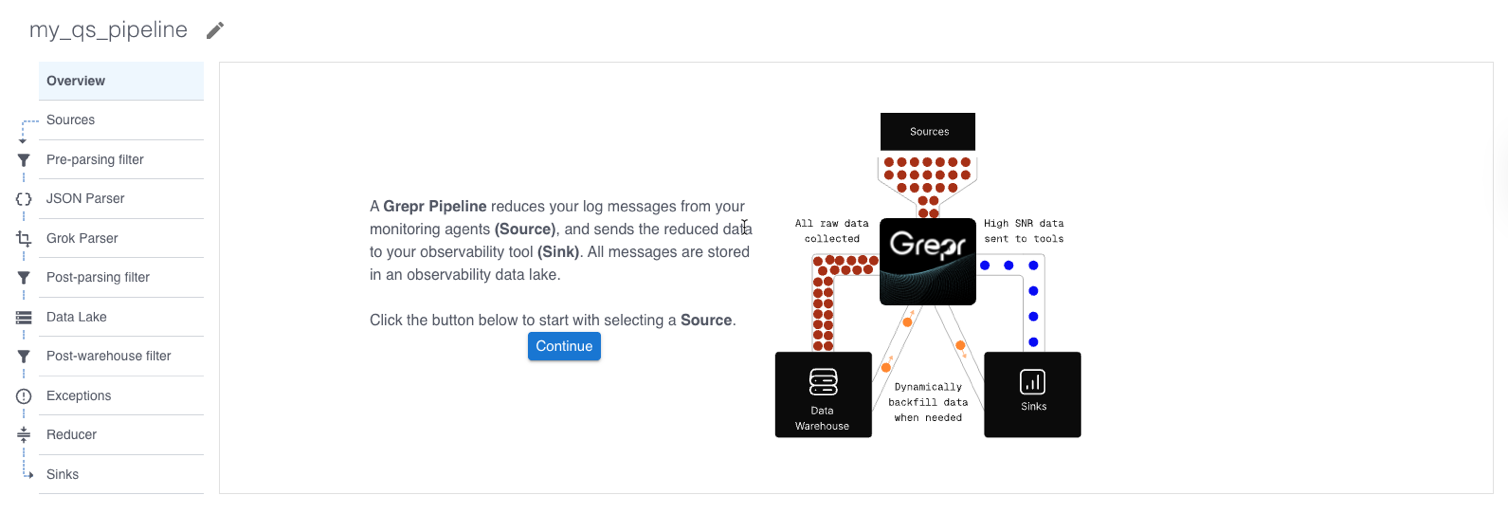
After clicking Create, the pipeline editor view appears. The left pane displays the flow for a log reduction pipeline. In the next step, you begin configuring the pipeline by adding a source.
Add a source for Datadog logs
To add a source in the pipeline editor, you first configure a Grepr integration. To create an integration and add a source:
-
Click Continue in the pipeline editor view.
-
Click Add integration.
-
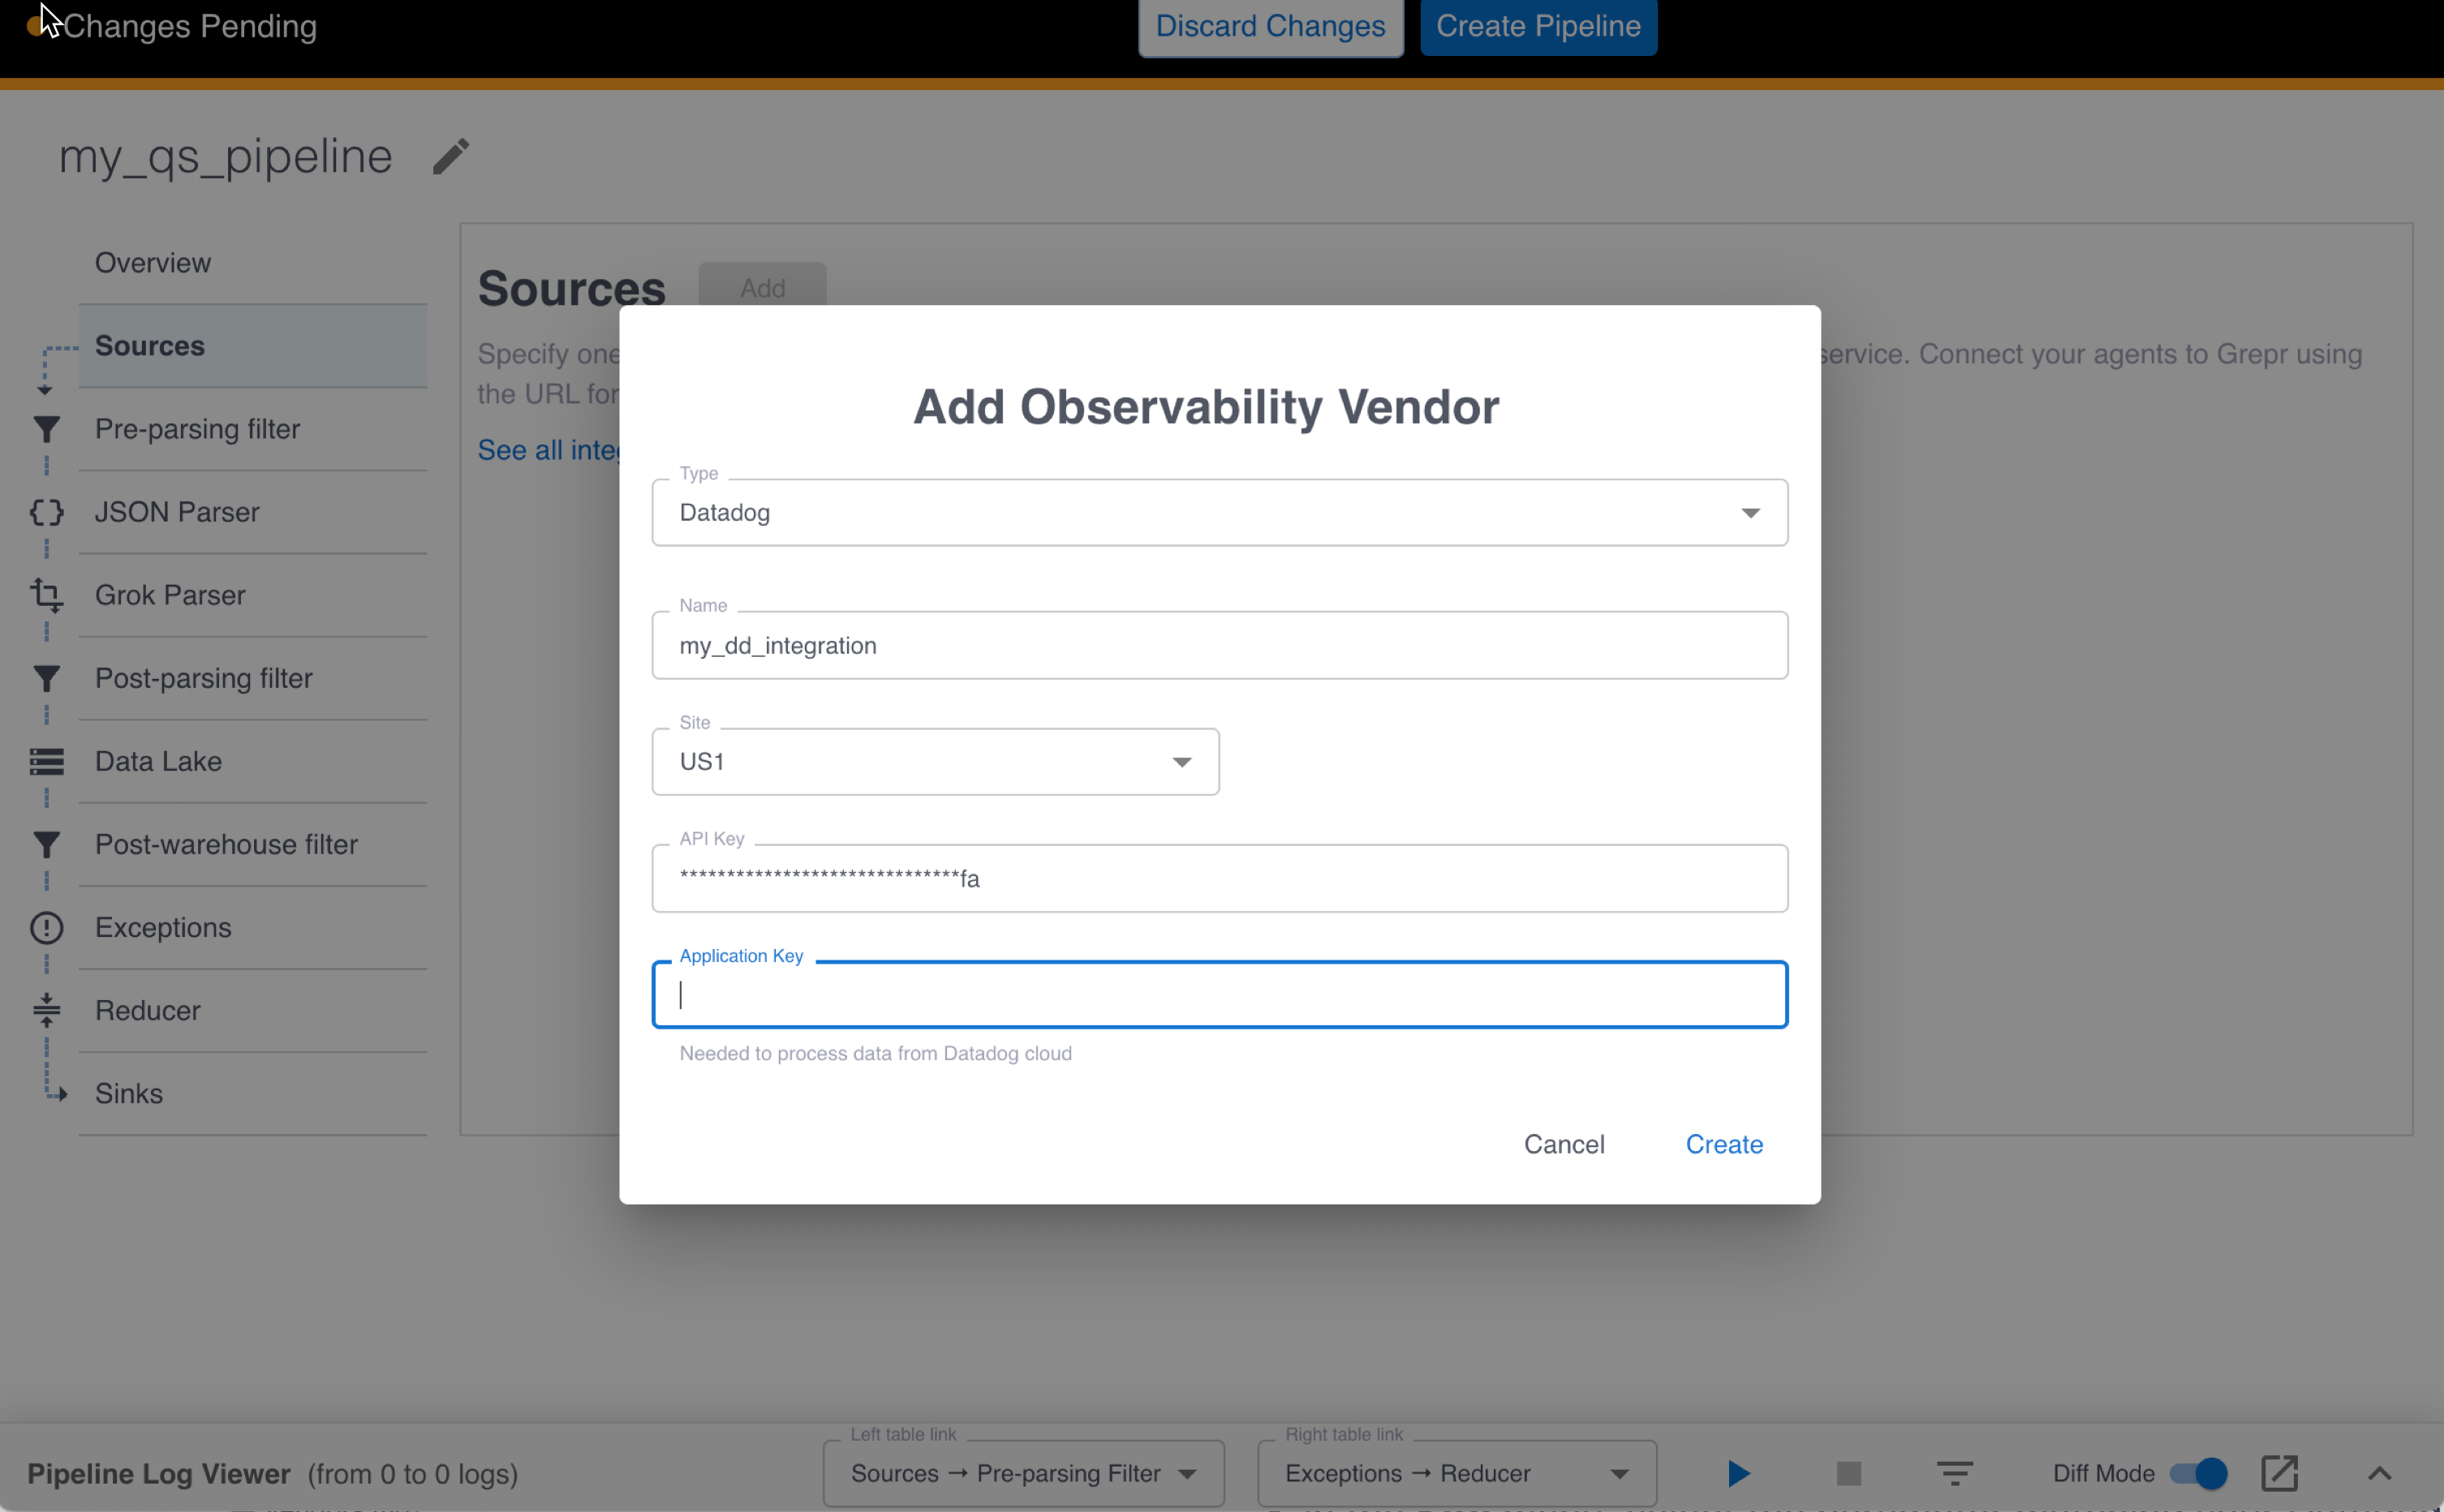
In the Add Observability Vendor dialog:
- In the Type menu, select Datadog.
- In the Name field, enter a name for the integration.
- In the Site menu, select the parameter matching your Datadog site.
- In the API Key field, enter your Datadog API key.
- Leave the Application Key field empty.
-
Click Create.
After clicking Create, Grepr validates the API key with Datadog, creates the integration, and returns a success message. If any issues are found, an error message is returned instead.
-
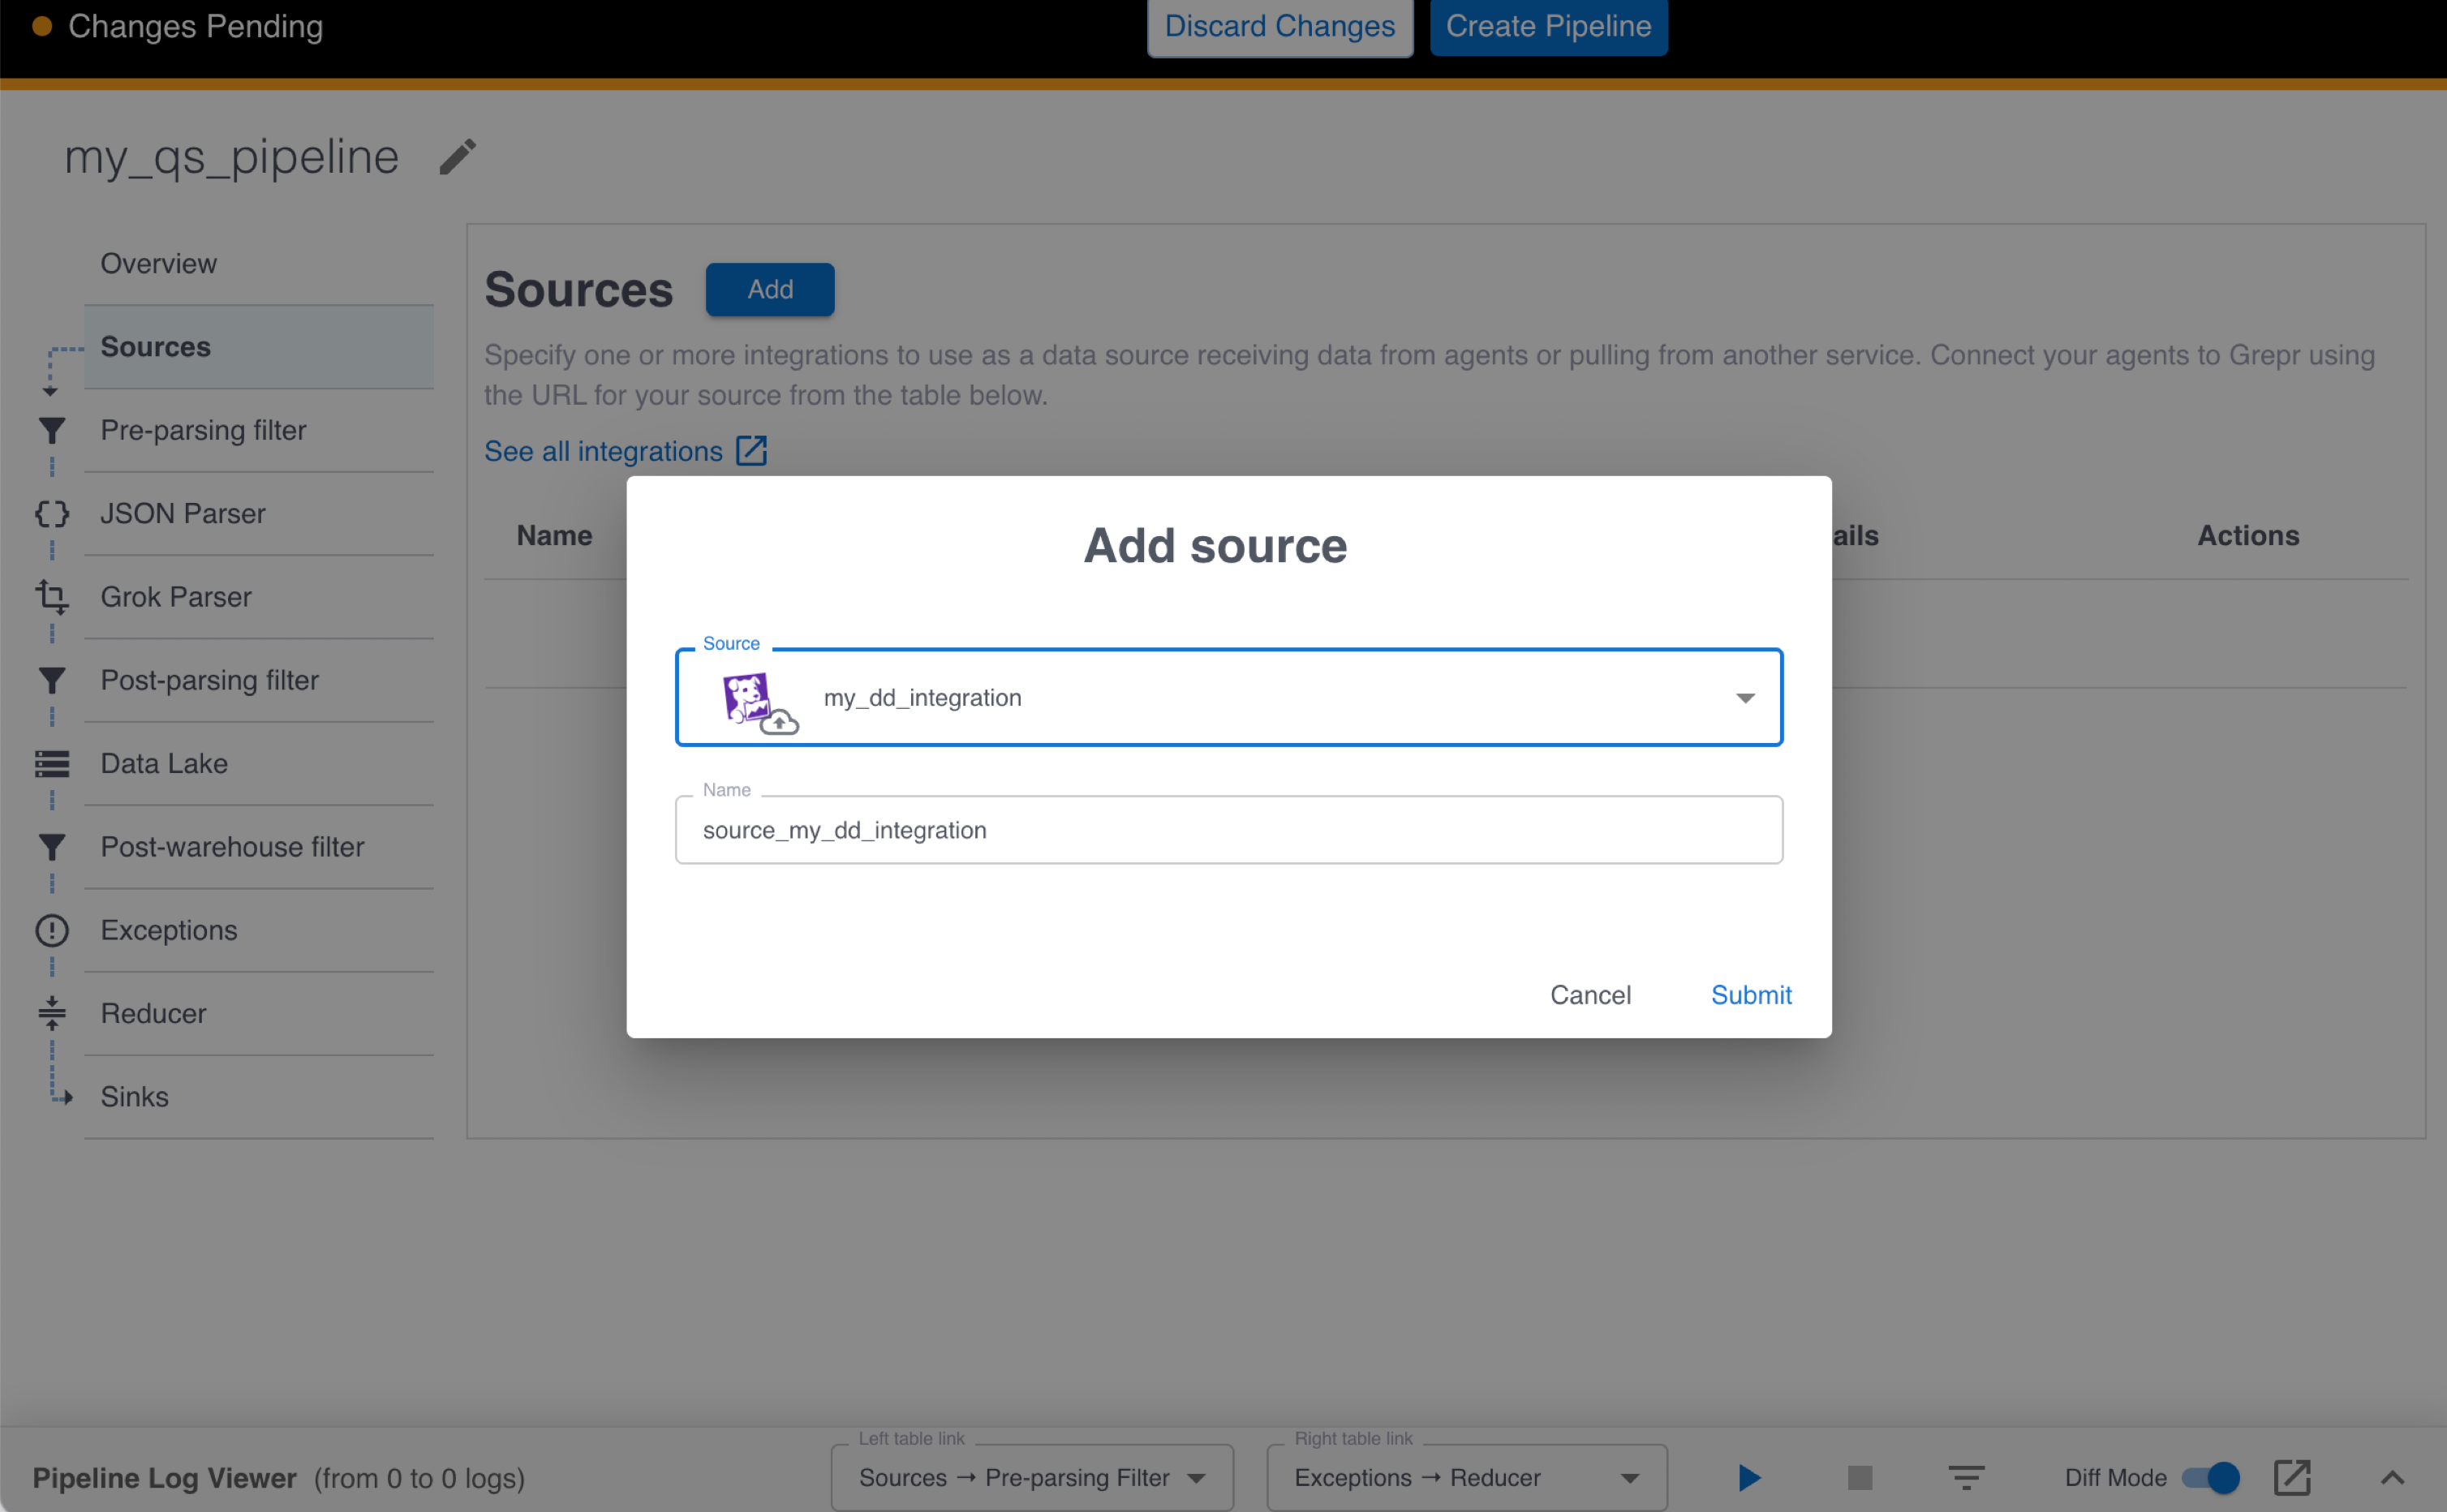
In the Add source dialog, select the Datadog integration you created in the previous step. A name for this source is automatically added for you.
-
Click Submit.
Add a data lake
To add a Grepr data lake to retain raw log data, you first configure a Grepr storage integration. To create a storage integration and add a data lake to your pipeline:
-
Click Data Lake in the left pane, then click Add.
-
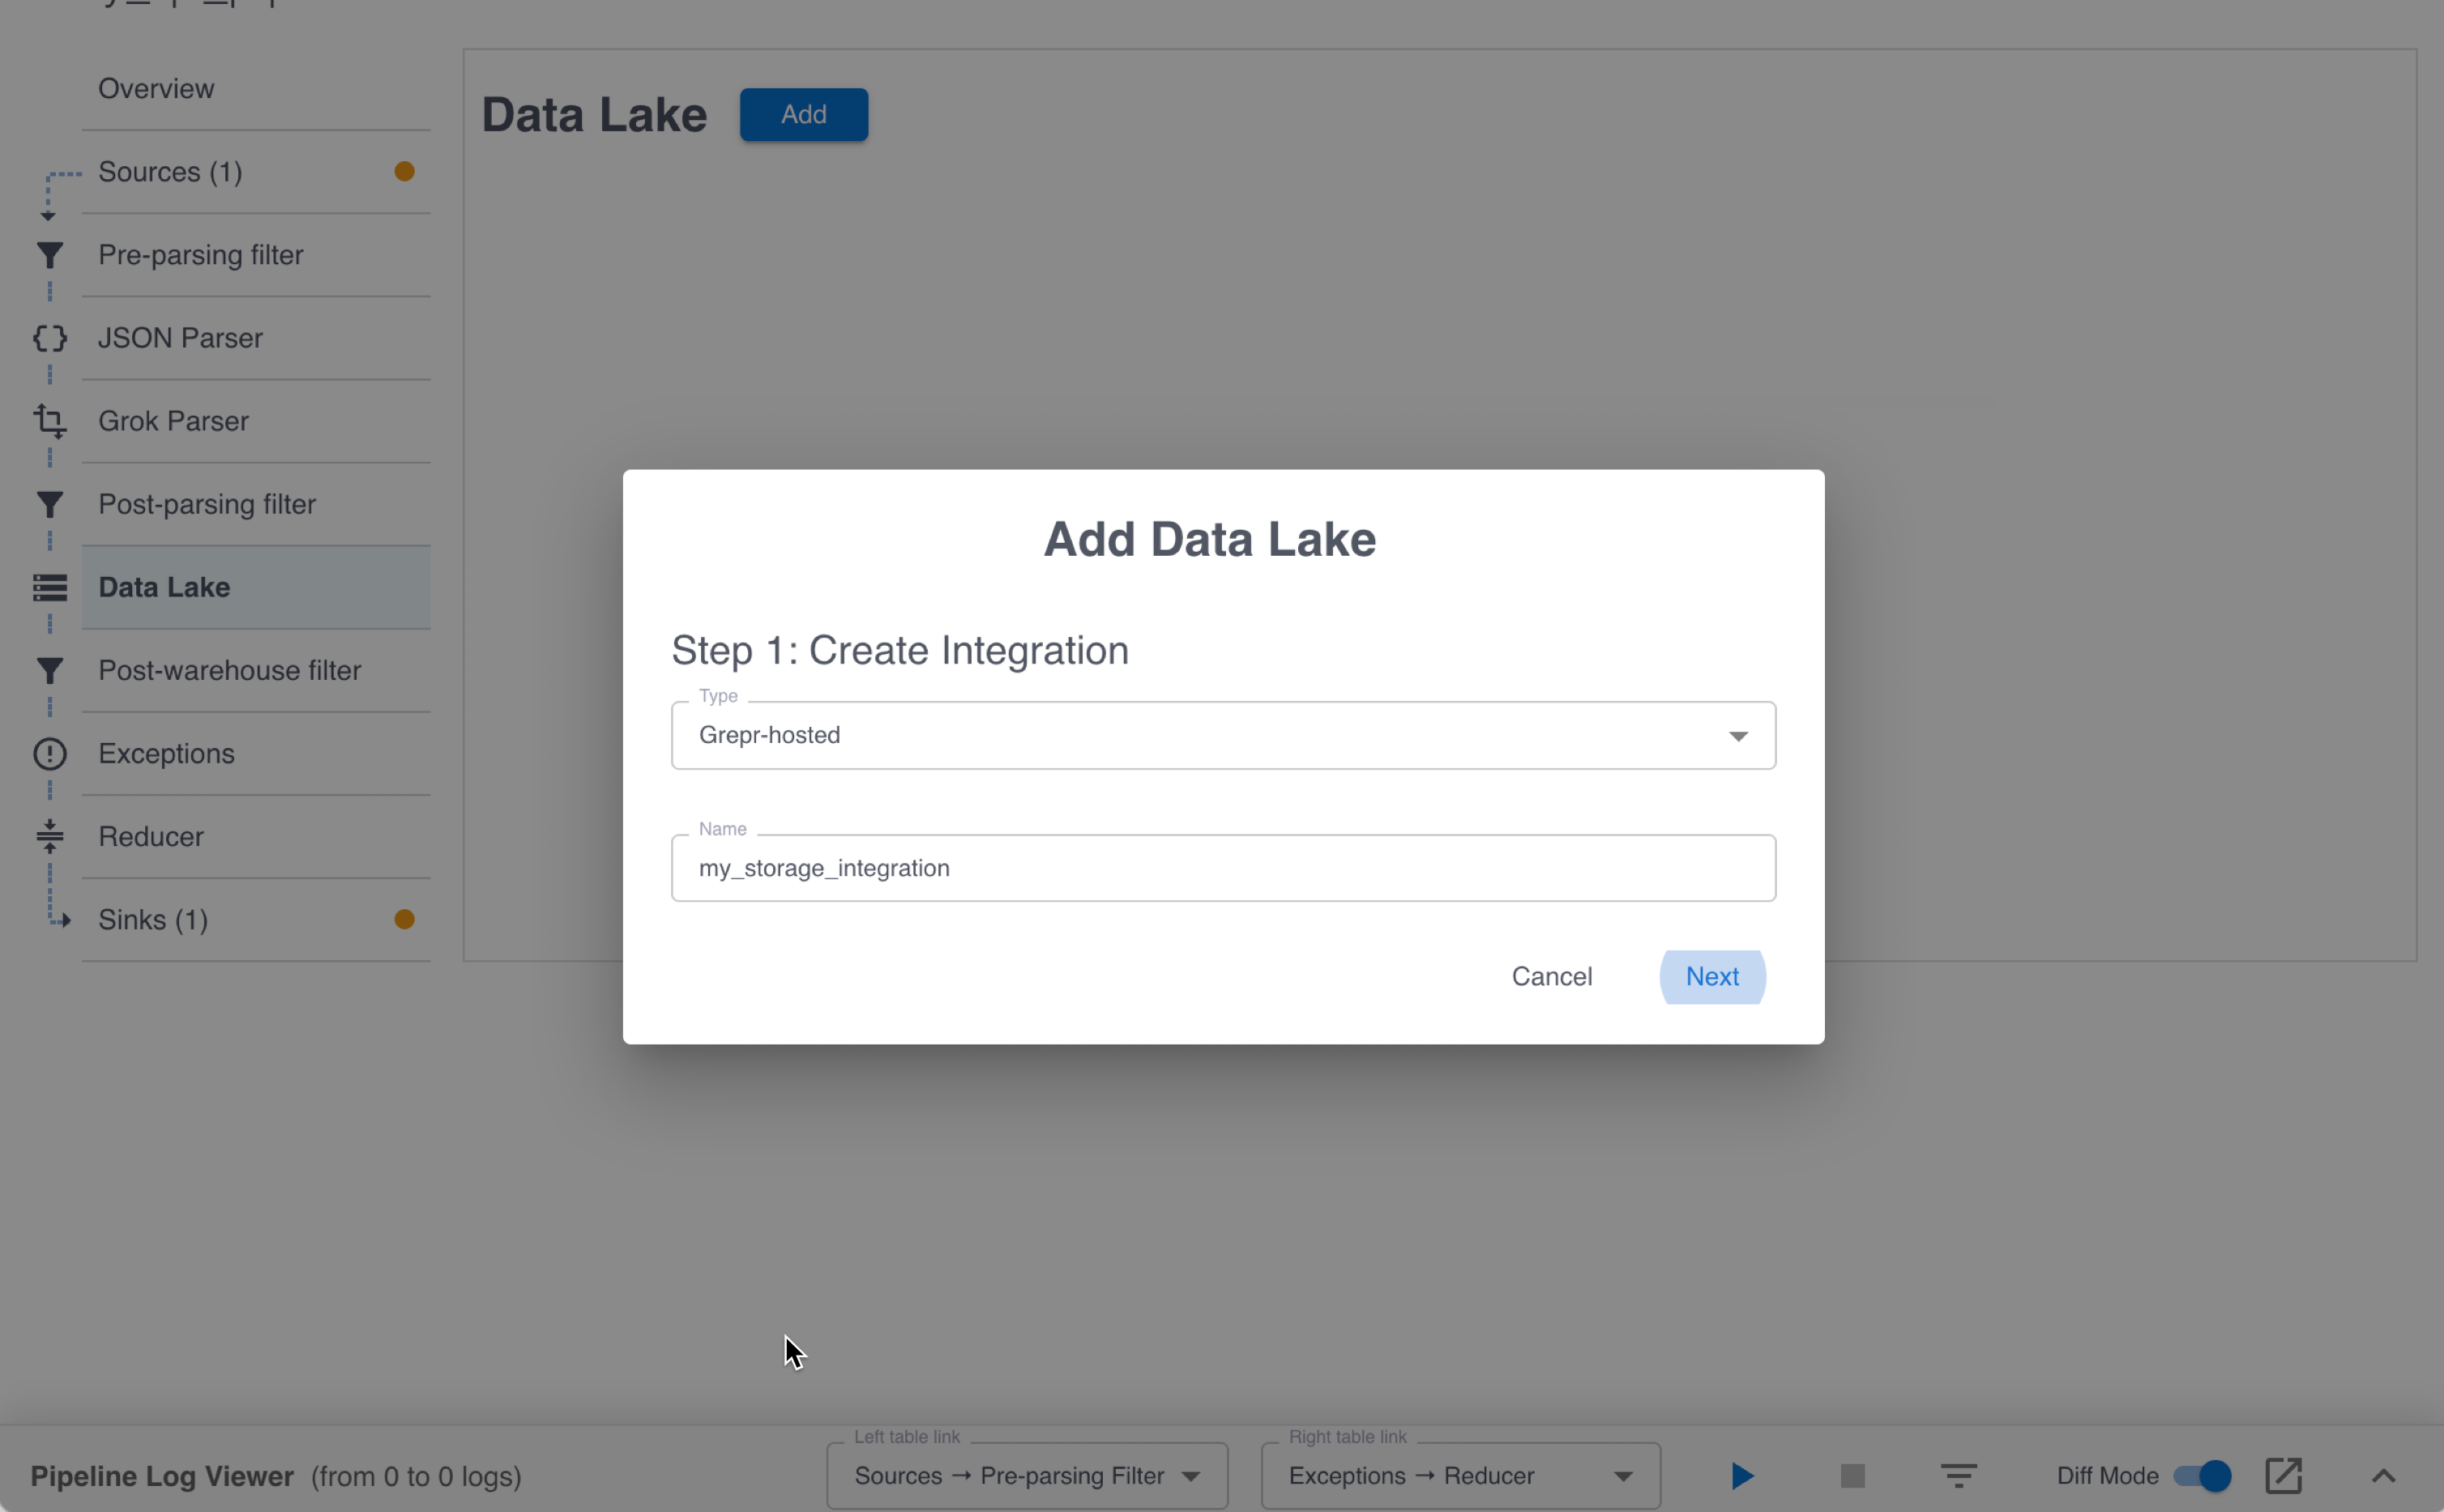
In the Add Data Lake dialog:
- In the Type menu, select Grepr-hosted.
- In the Name field, enter a name for the integration.
-
Click Next.
-
In the Dataset Name field, enter a name for the dataset to contain raw data. This can be any name you choose, but it should be descriptive.
-
In the Integration menu, select the storage integration you created in the previous step.
-
Click Add.
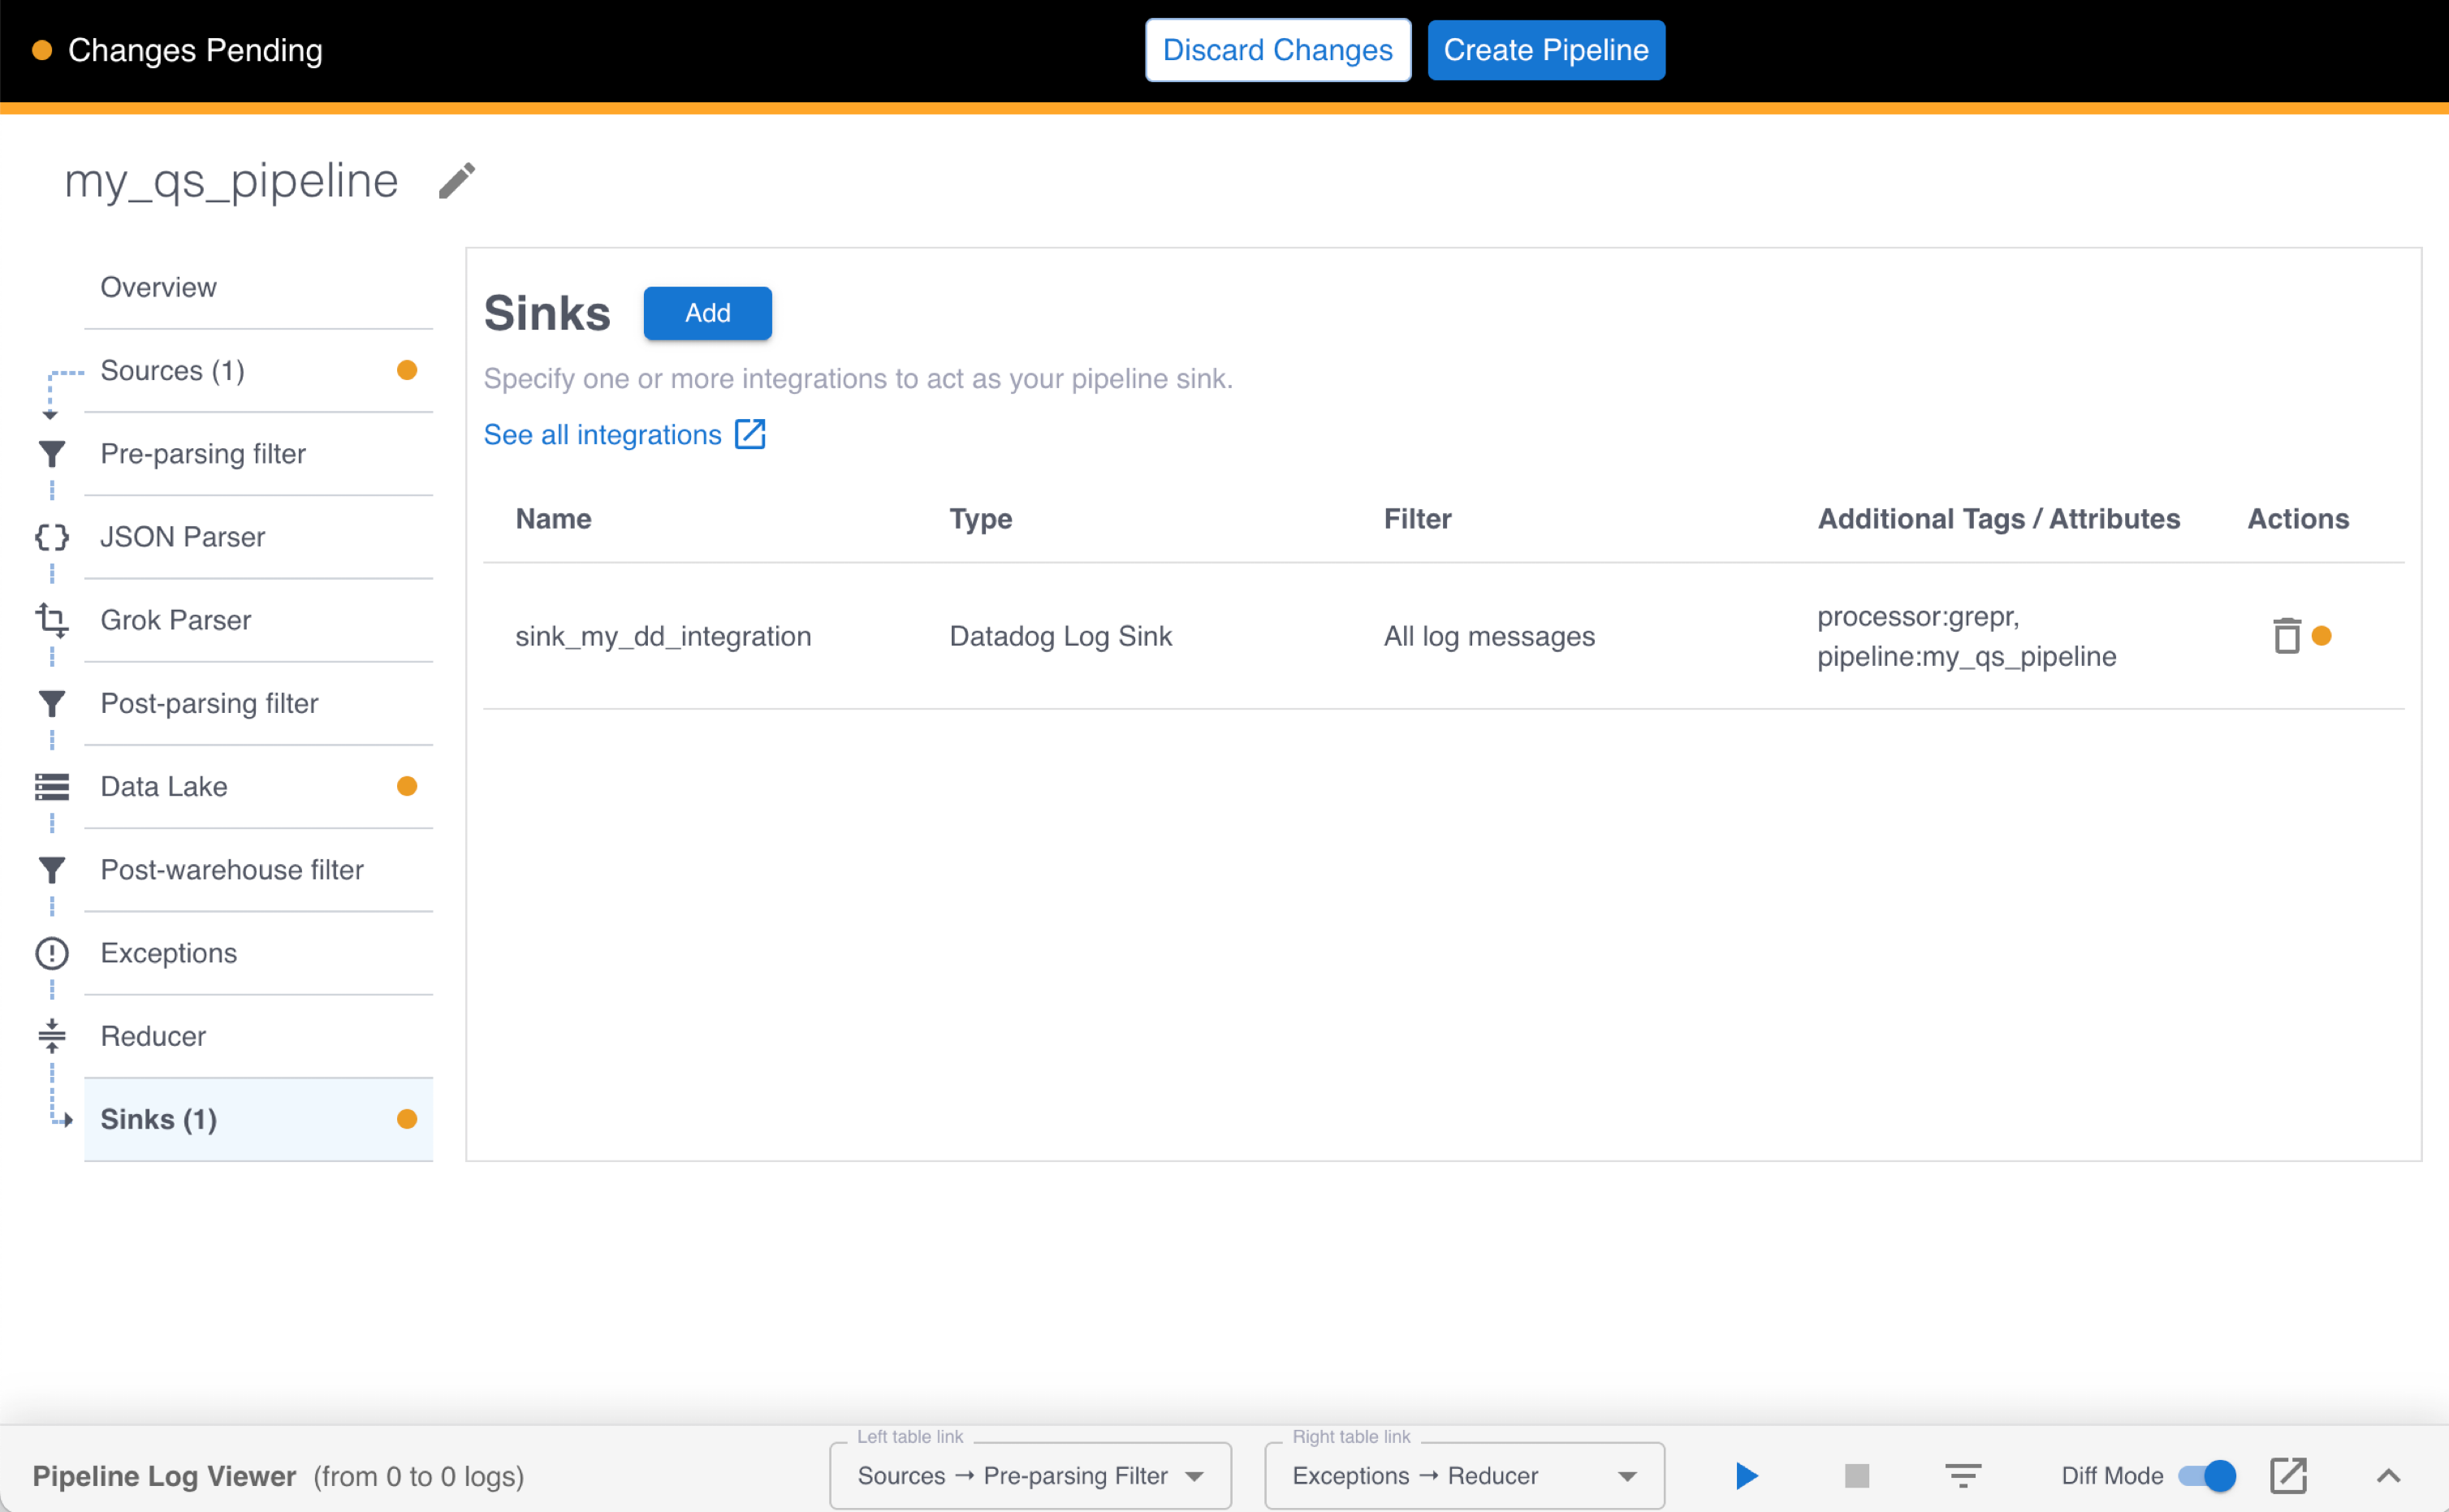
To send the processed logs to Datadog, a sink is automatically added to your pipeline. Click Sinks in the left pane to view the sink. Under Additional Tags / Attributes, you can see automatically populated tags. These tags are appended to messages before they’re sent to Datadog. Grepr recommends retaining these tags because they allow you to distinguish Grepr-processed logs from other logs.
Step 3: Create and start the pipeline
Click Create Pipeline in the top bar, then click Confirm in the Create pipeline dialog. Your pipeline will shortly go from Starting to Running. When the pipeline reaches the Running state, it’s ready to start processing logs. In the next step, you simulate sending log messages through your pipeline.
Step 4: Simulate multiple agents sending logs through Grepr
-
Before sending log messages to your pipeline, make sure no Docker containers are running the Datadog agent. In a terminal, run the following command:
docker stop dd-agent -
To configure the Datadog agents to send logs to Grepr, you need the Grepr ingestion URL. To find the URL, click Sources in the left pane and copy the Ingest URL value.
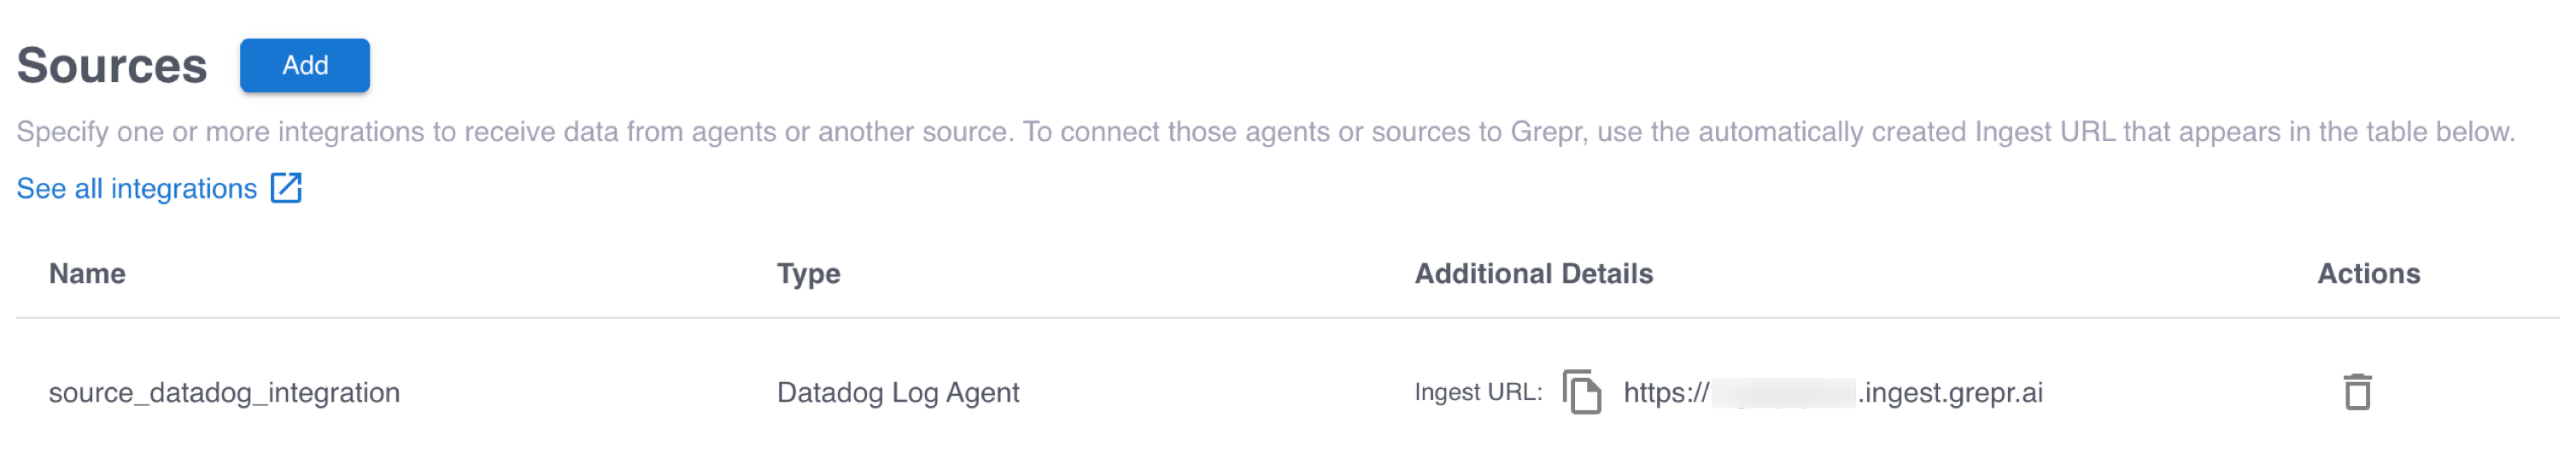
-
To start five agents to send logs through Grepr, run the following command, replacing
INGESTION_URLwith the Grepr ingestion URL you copied above, andDD_API_KEY_VALUEwith your Datadog API key:for i in $(seq 1 5); do docker run -d --rm --name dd-agent-$i \ -e DD_API_KEY=DD_API_KEY_VALUE \ -e DD_SITE="datadoghq.com" \ -e DD_LOGS_ENABLED=true \ -e DD_LOGS_CONFIG_CONTAINER_COLLECT_ALL=true \ -e DD_HOSTNAME=my-test-host-$i \ -v /var/run/docker.sock:/var/run/docker.sock:ro \ -v /proc/:/host/proc/:ro \ -v /sys/fs/cgroup/:/host/sys/fs/cgroup:ro \ -e DD_LOGS_CONFIG_LOGS_DD_URL=INGESTION_URL \ -e DD_LOGS_CONFIG_USE_HTTP="true" \ gcr.io/datadoghq/agent:latest; doneThis command starts five agents, each with a different hostname. There are two new environment variables added to the command:
DD_LOGS_CONFIG_LOGS_DD_URLandDD_LOGS_CONFIG_USE_HTTP. The first variable provides the agents with the Grepr URL to send logs to, and the second variable tells the agents to use HTTPS instead of TCP when sending logs to Grepr.Before sending logs for ingestion, ensure there’s at least one running pipeline that includes a Datadog source that matches the Datadog integration you created in Step 2. If a pipeline doesn’t exist, the ingestion requests are not accepted.
View the results
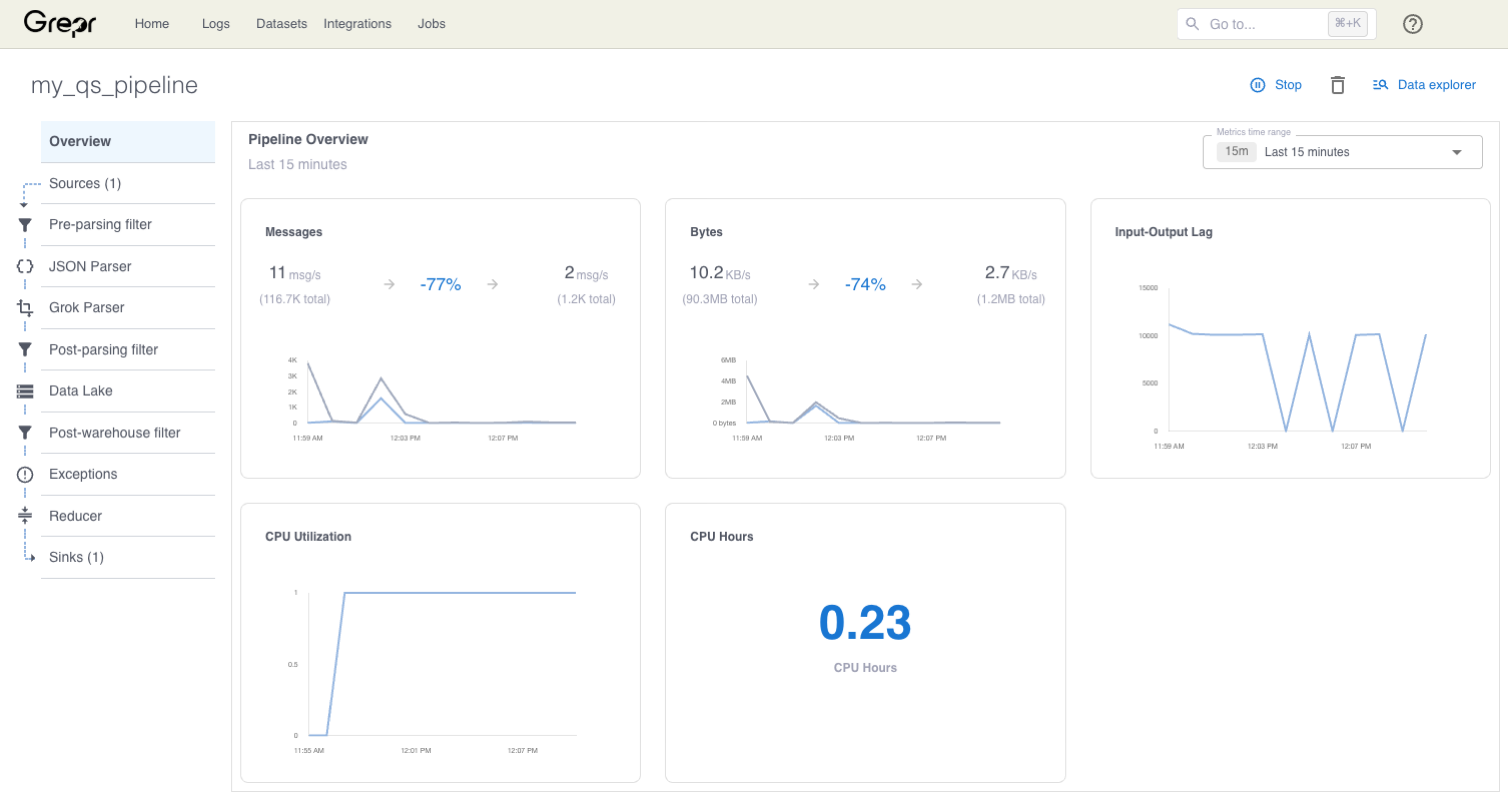
After the agents are running, to monitor log ingestion activity, go to the Grepr Pipelines UI and select Overview.
To see the logs arriving to Datadog, go to the Datadog Log Explorer. To filter for only messages arriving from your test agents, enter host:my-test-host* in the Filter your logs text box.
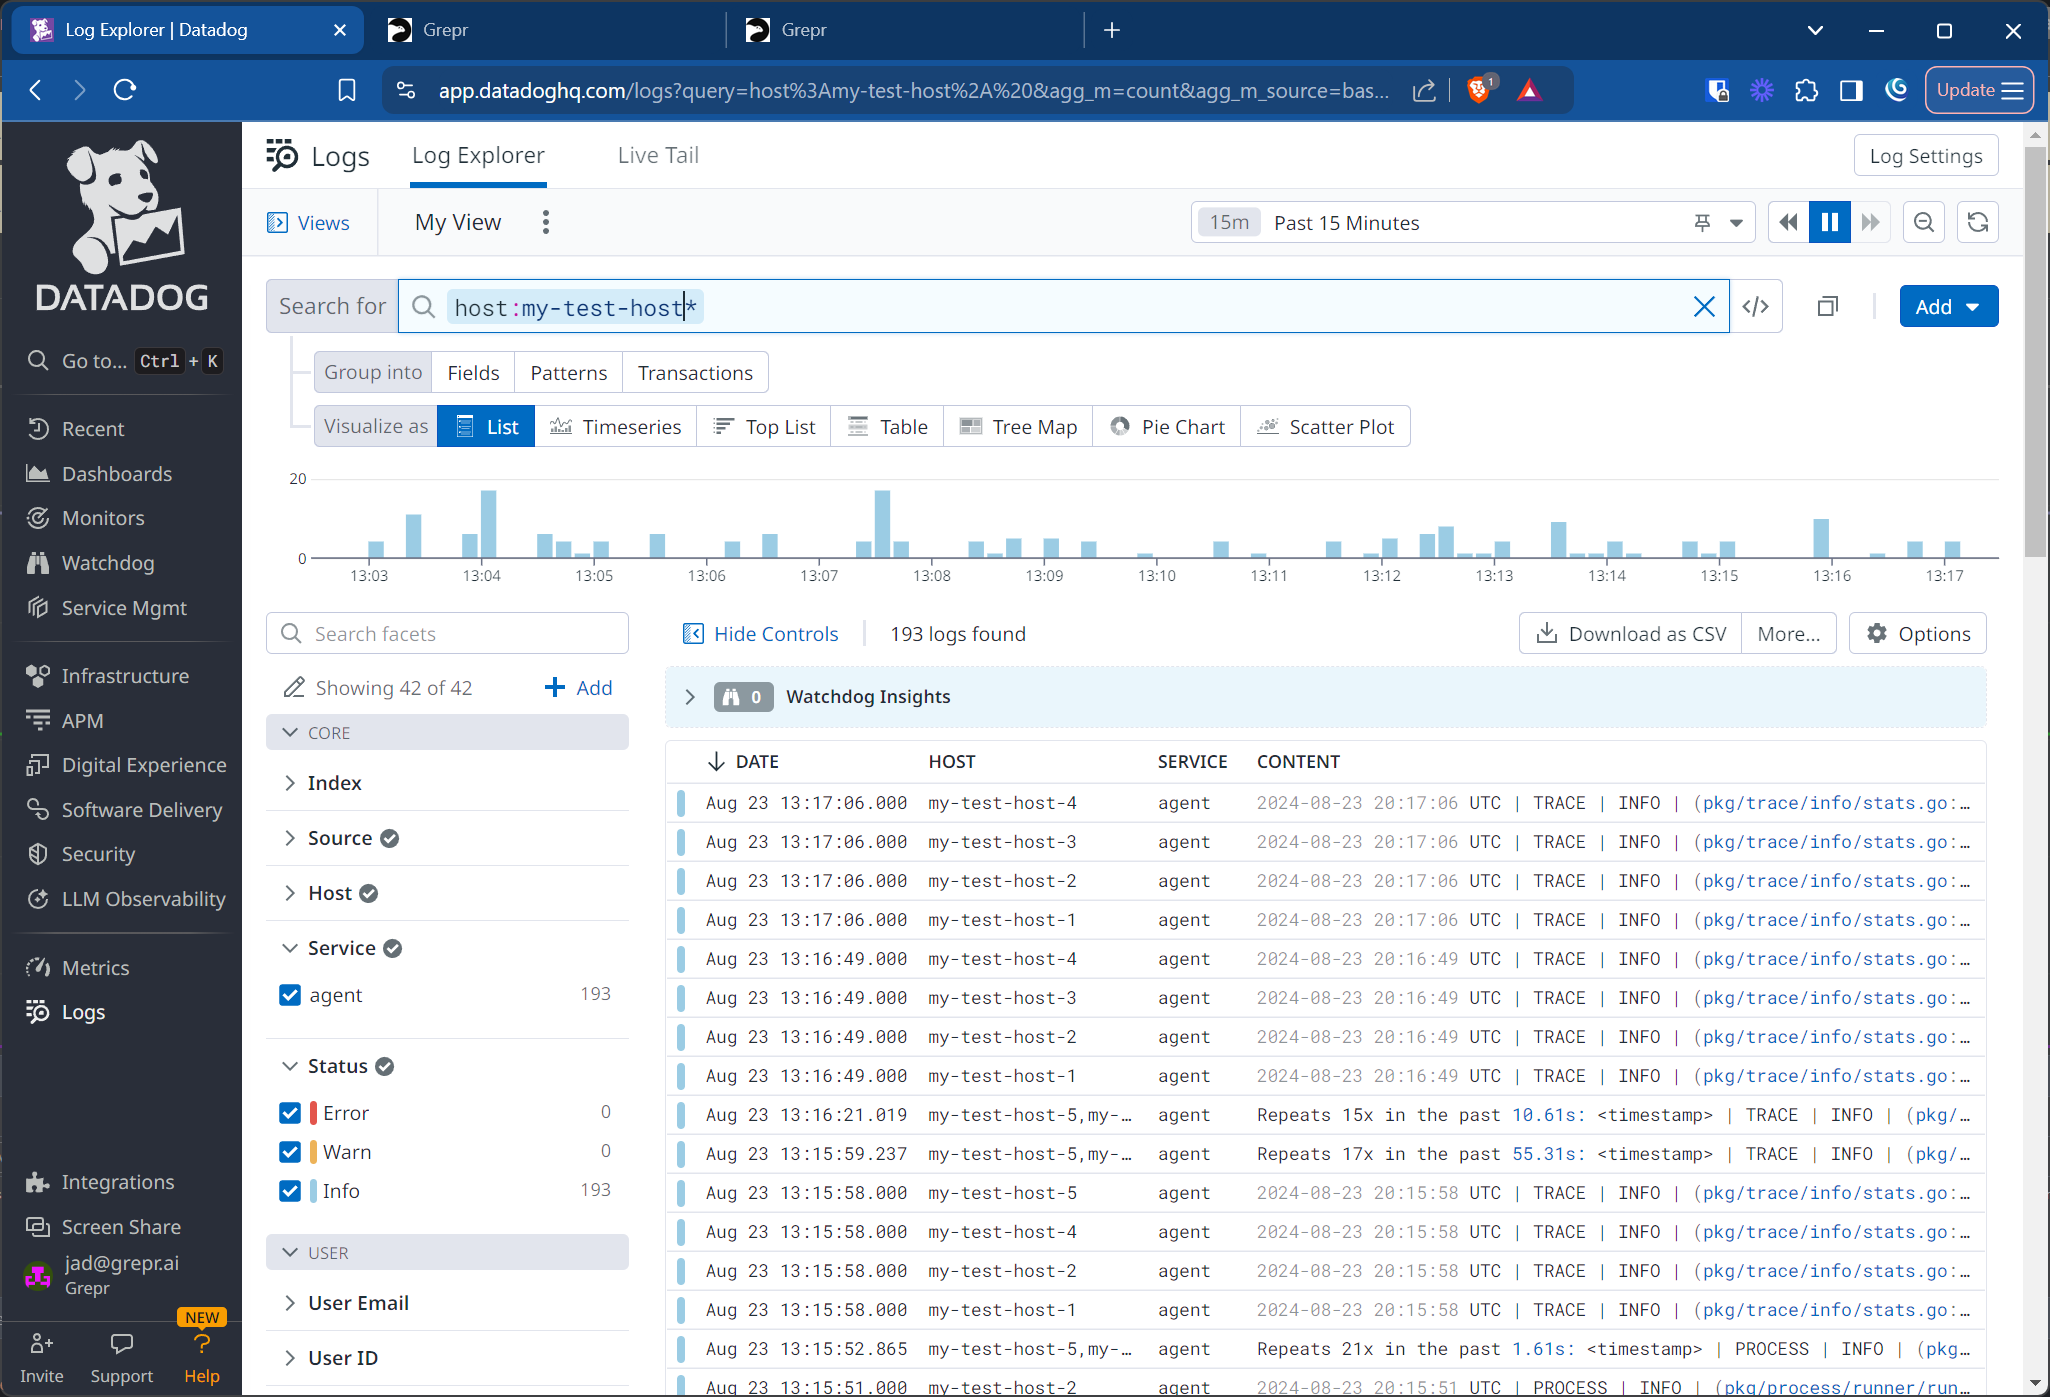
When you scroll through the logs in the Datadog Log Explorer, you can see that repeated log events are aggregated. This aggregation, which reduces the data volumes sent to Datadog, is the result of the Grepr log reducer. To learn more about the log reducer, see Reduce shipped data volumes with the Grepr log reducer.
Cleaning up
When you’ve finished the tutorial, you can stop the Datadog agents by running the following command in a terminal:
for i in $(seq 1 5); do docker stop dd-agent-$i; doneTo stop the pipeline, go to the Grepr UI home page, click the More options icon (⋮) in the top-right corner of the pipeline card, select Stop, and then confirm that you would like to stop the pipeline.
Next steps
To see an example of troubleshooting incidents with Grepr and Datadog, see the troubleshooting tutorial.