Tutorial: Troubleshoot incidents with Grepr-processed data and your observability tool
This tutorial describes how to use your observability tools to examine Grepr-processed log data, providing a powerful tool for investigating and troubleshooting issues in your infrastructure or applications.
This tutorial describes using the Datadog UI to work with log data, but you can follow the same steps with any Grepr-supported observability tool. For the complete list of supported observability vendors, see Supported integrations.
Requirements
To use the example in this tutorial, you must first complete the Build your first Grepr pipeline tutorial, which creates the processed logs used by this tutorial.
Troubleshooting Example
Suppose you need to find the root cause of a production incident. As part of your investigation, you need to view the raw log messages that Grepr aggregated into a summary message. To find the raw log messages, you can use the following steps:
-
In the Datadog Log Explorer, open one of the summary messages. These are messages that start with
Repeats Nx in the past.... Grepr replaces parameters that change between aggregated messages with a placeholder, such as<number>,<timestamp>, or<any>.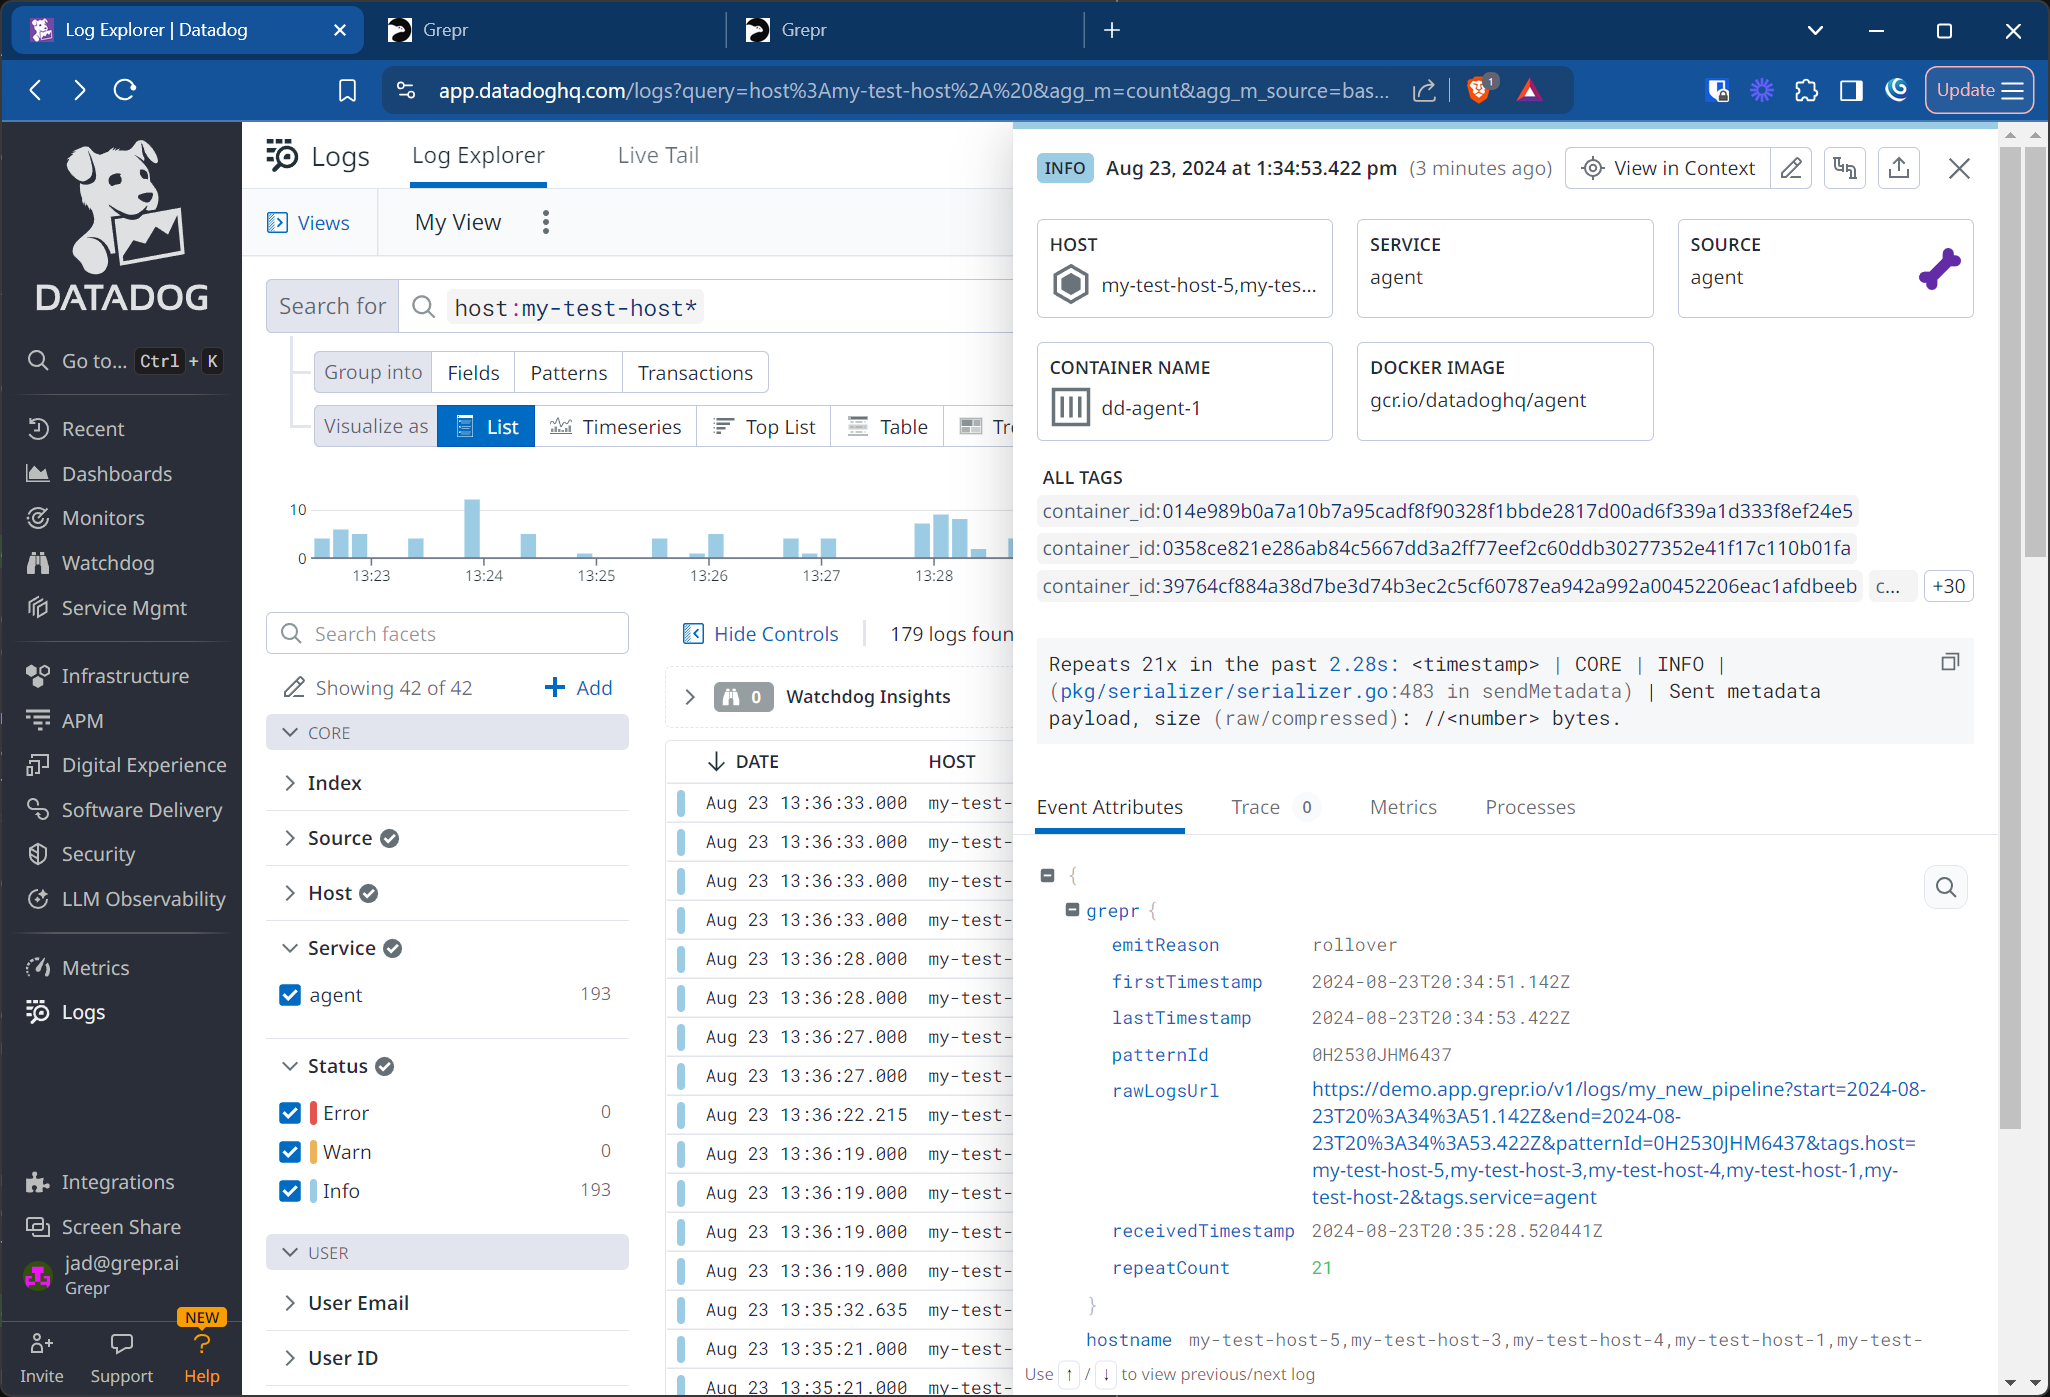
In this example message, Grepr has identified a
timestampparameter and anumberparameter that change between log messages. You can also see some Grepr-specific fields in the details, including:firstTimestampandlastTimestampare the timestamps of the first and last log message that Grepr aggregated into this summary message.receivedTimestampis the timestamp when Grepr created this summary message.patternIdis the identifier of the pattern matched by messages in this summary.rawLogsUrlis a URL that you can click on to see the raw log messages from the Grepr data lake that Grepr aggregated into this summary message.repeatCountis the number of log messages that Grepr aggregated into this summary message.
-
To find the other messages that belong to this summary’s pattern, hover over
patternIdand click Filter by@grepr.patternId:<pattern-id>, where<pattern-id>is the unique pattern identifier of the aggregated messages.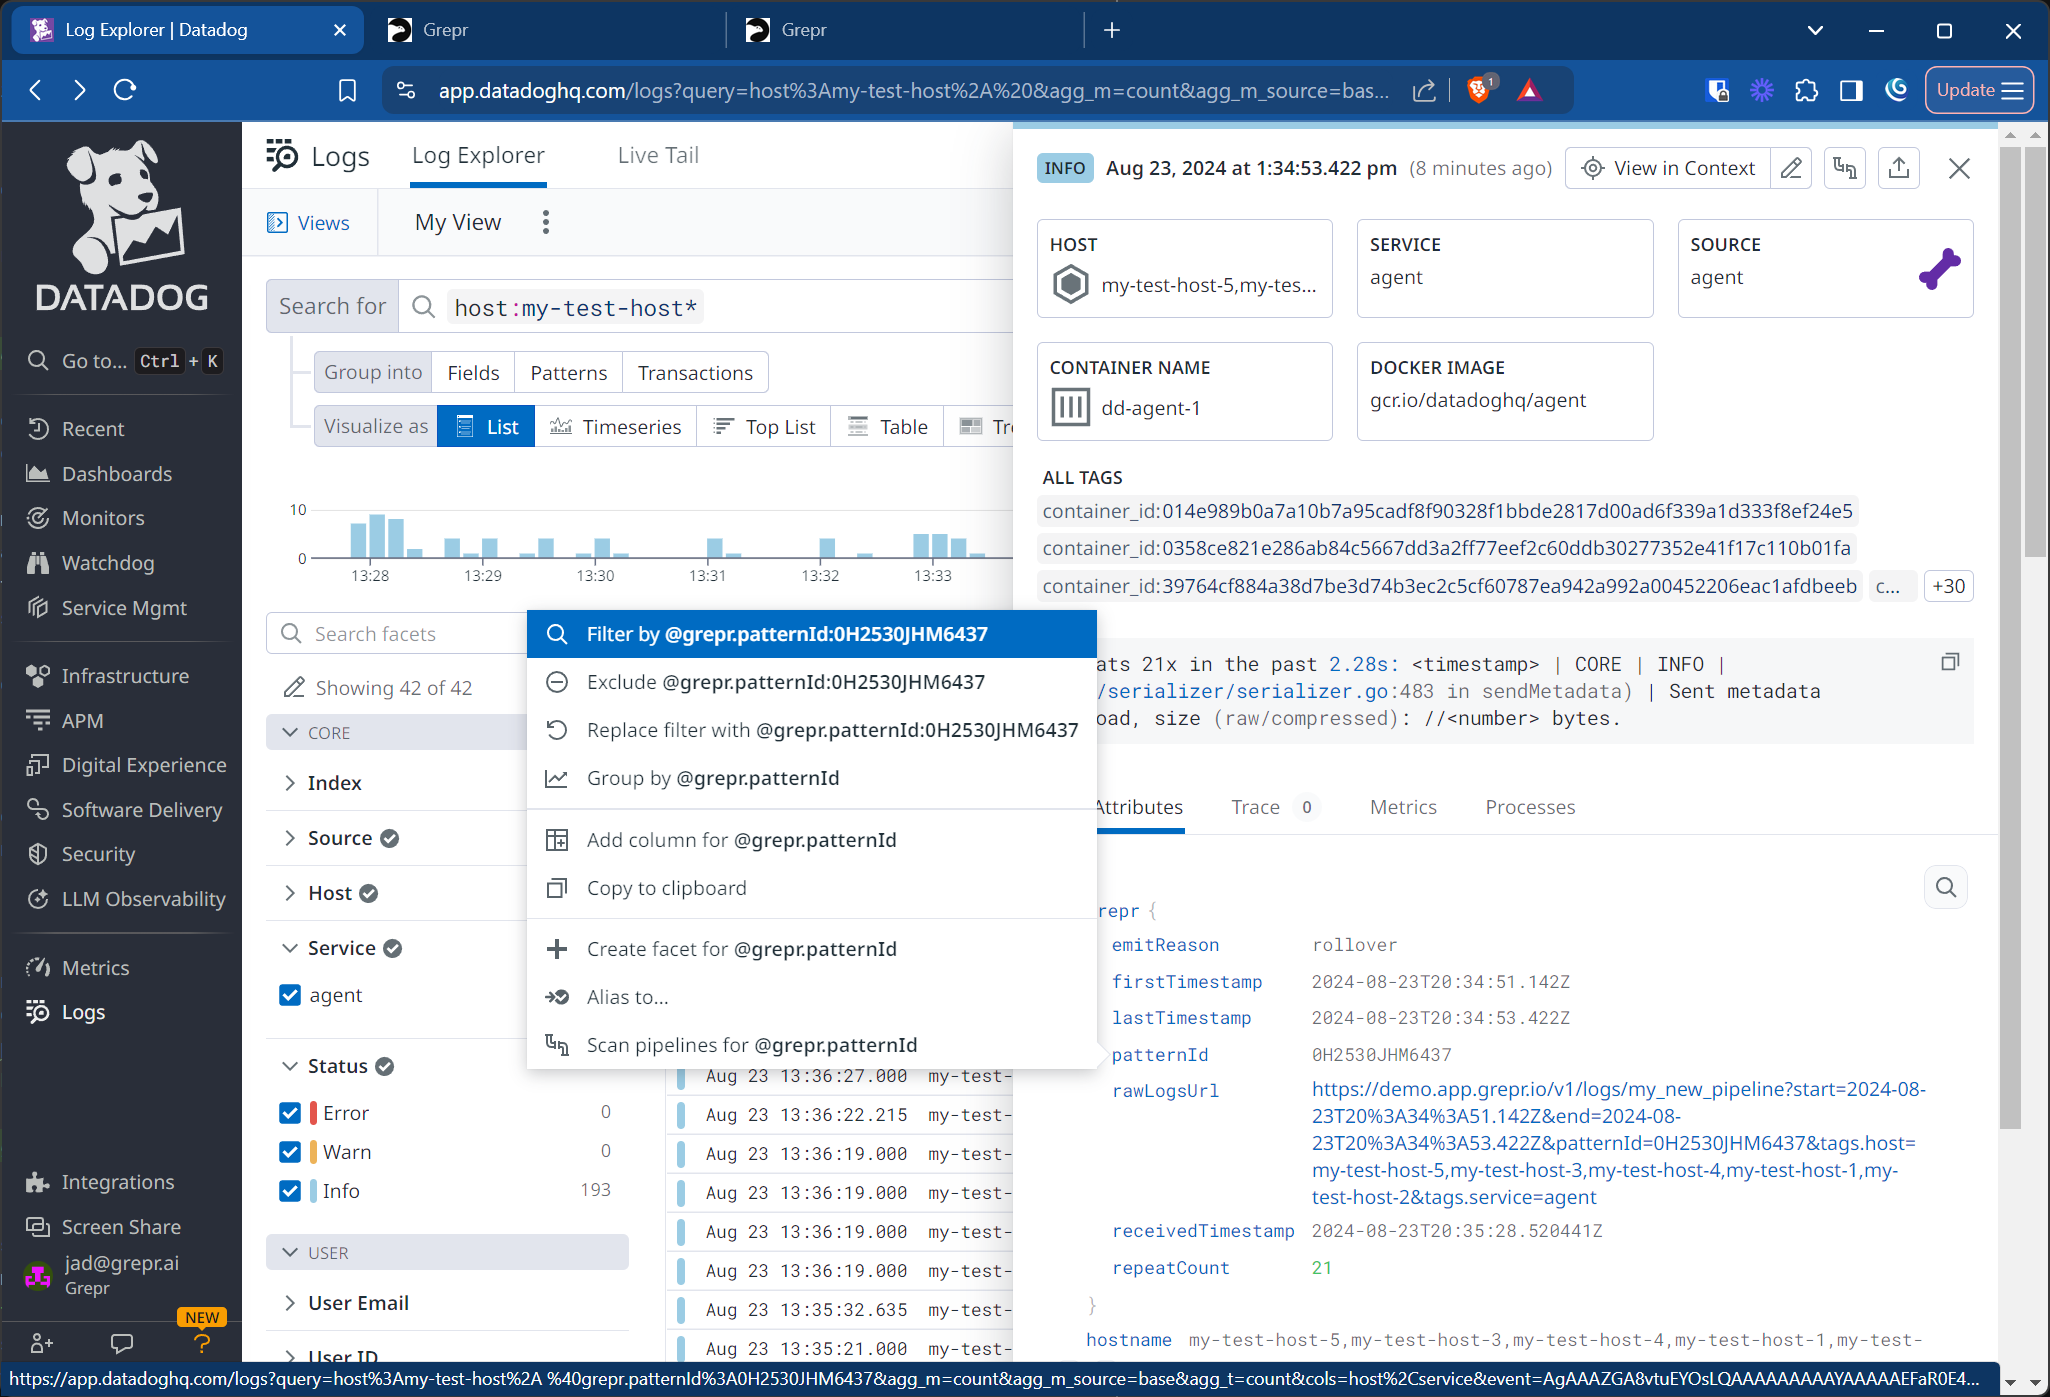
This selection filters the logs to display only log messages with the same pattern as the selected message.
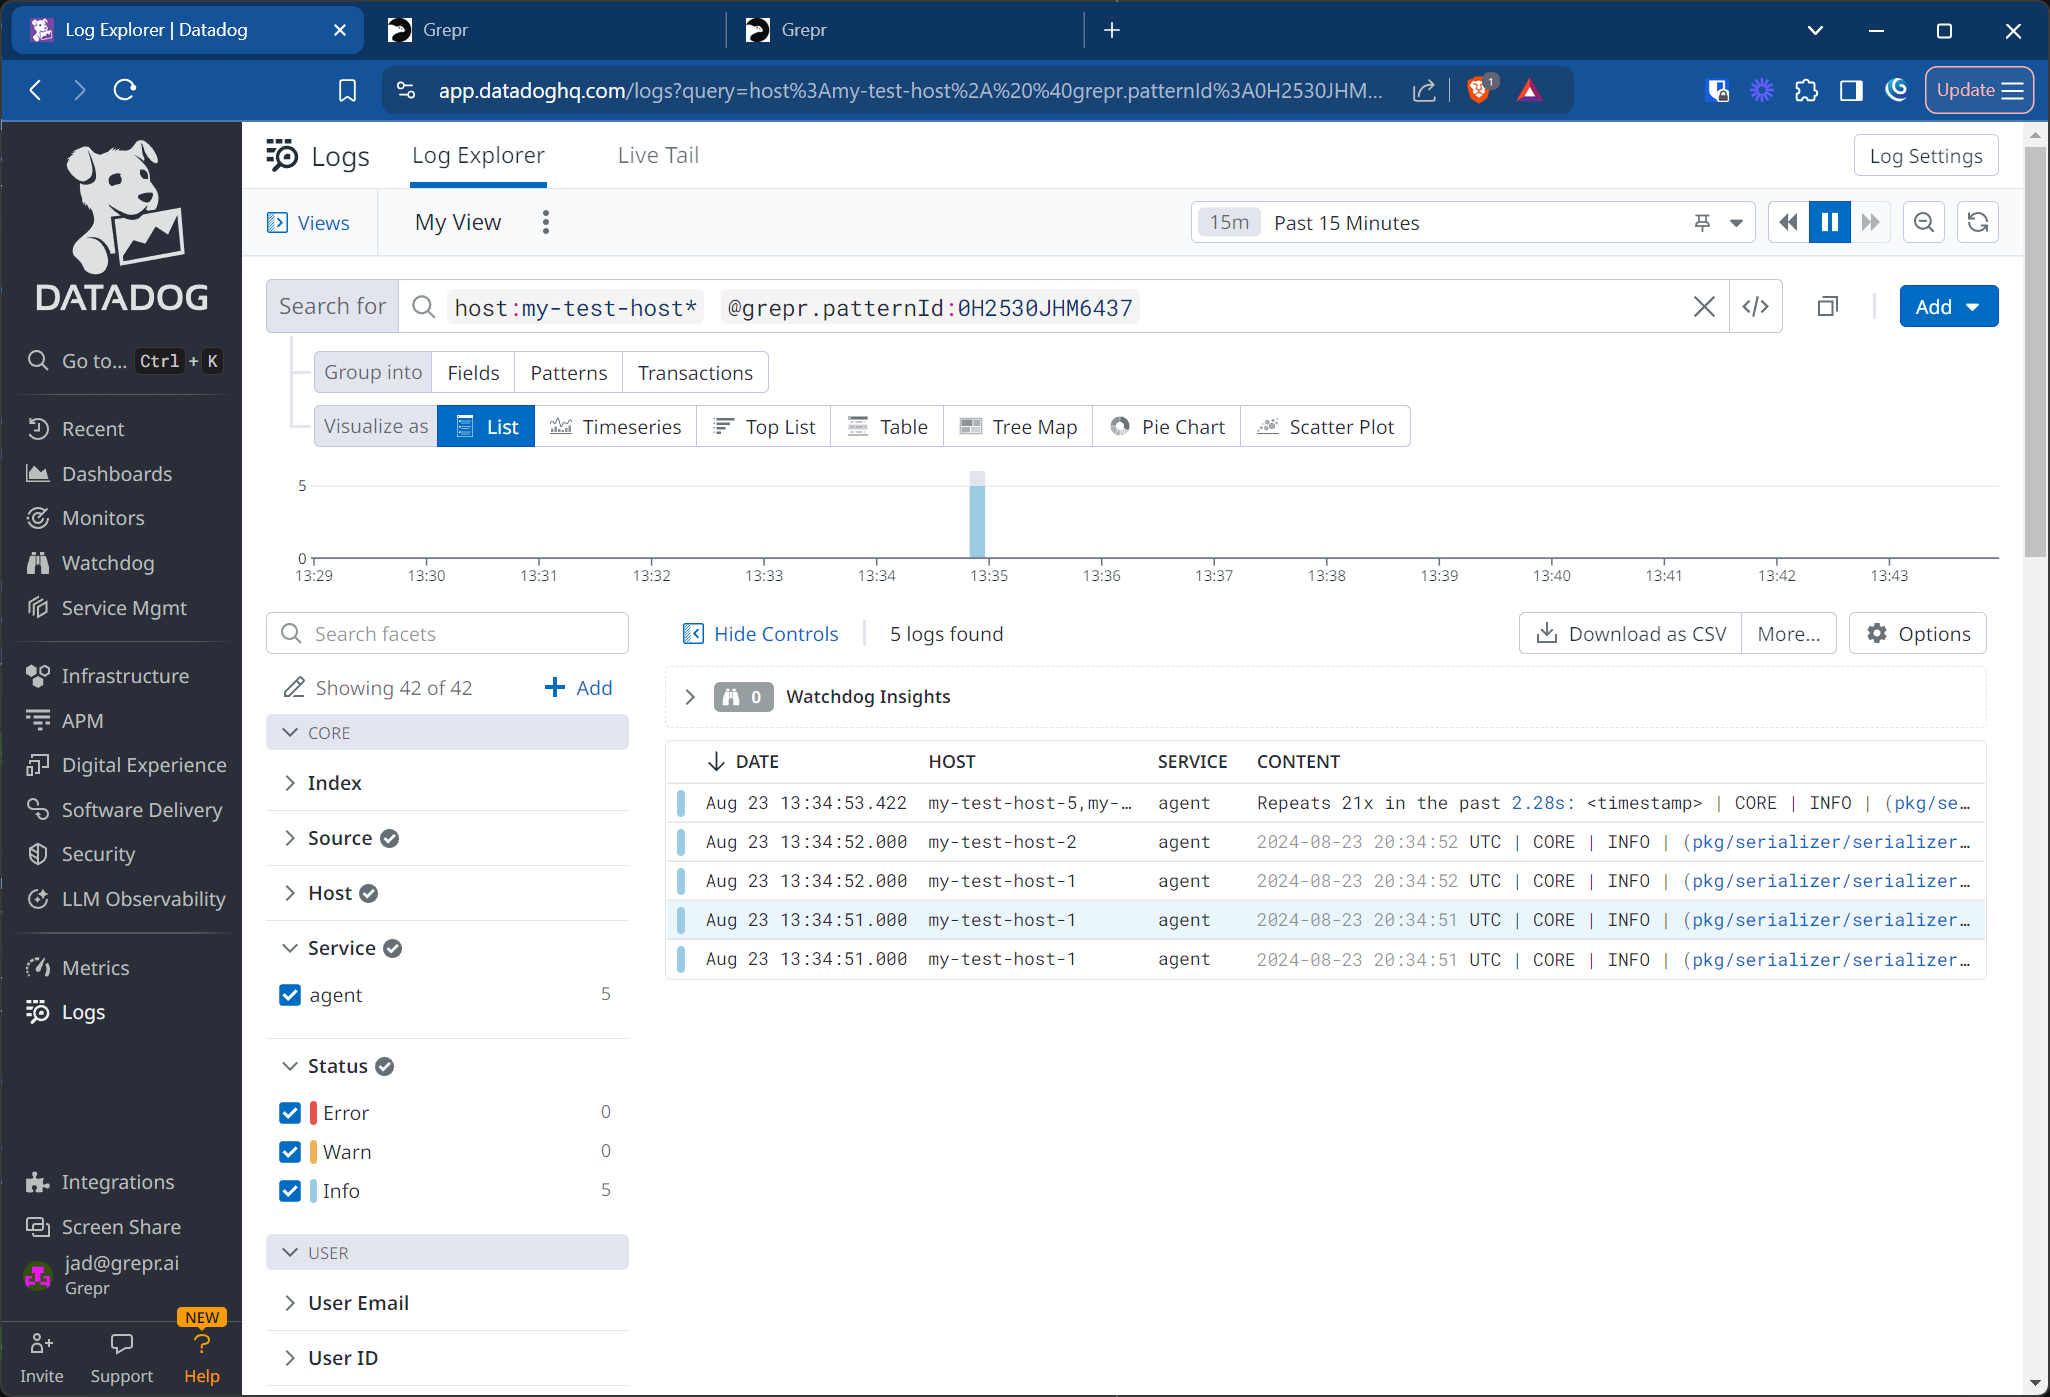
You might see multiple summary messages with the same pattern ID. This is expected behavior and indicates that Grepr is actively aggregating these messages. For example:
- Frequent pattern: The pattern ID might be reused over long periods if the same pattern occurs frequently in your logs, resulting in multiple summary messages for the same pattern ID.
- Late-arriving data: If a message arrives after a summary message is created, Grepr creates a new summary message to include the late-arriving message, ensuring you receive the late-arriving data correctly.
-
Reopen the summary message and click the URL in the rawLogsUrl field.
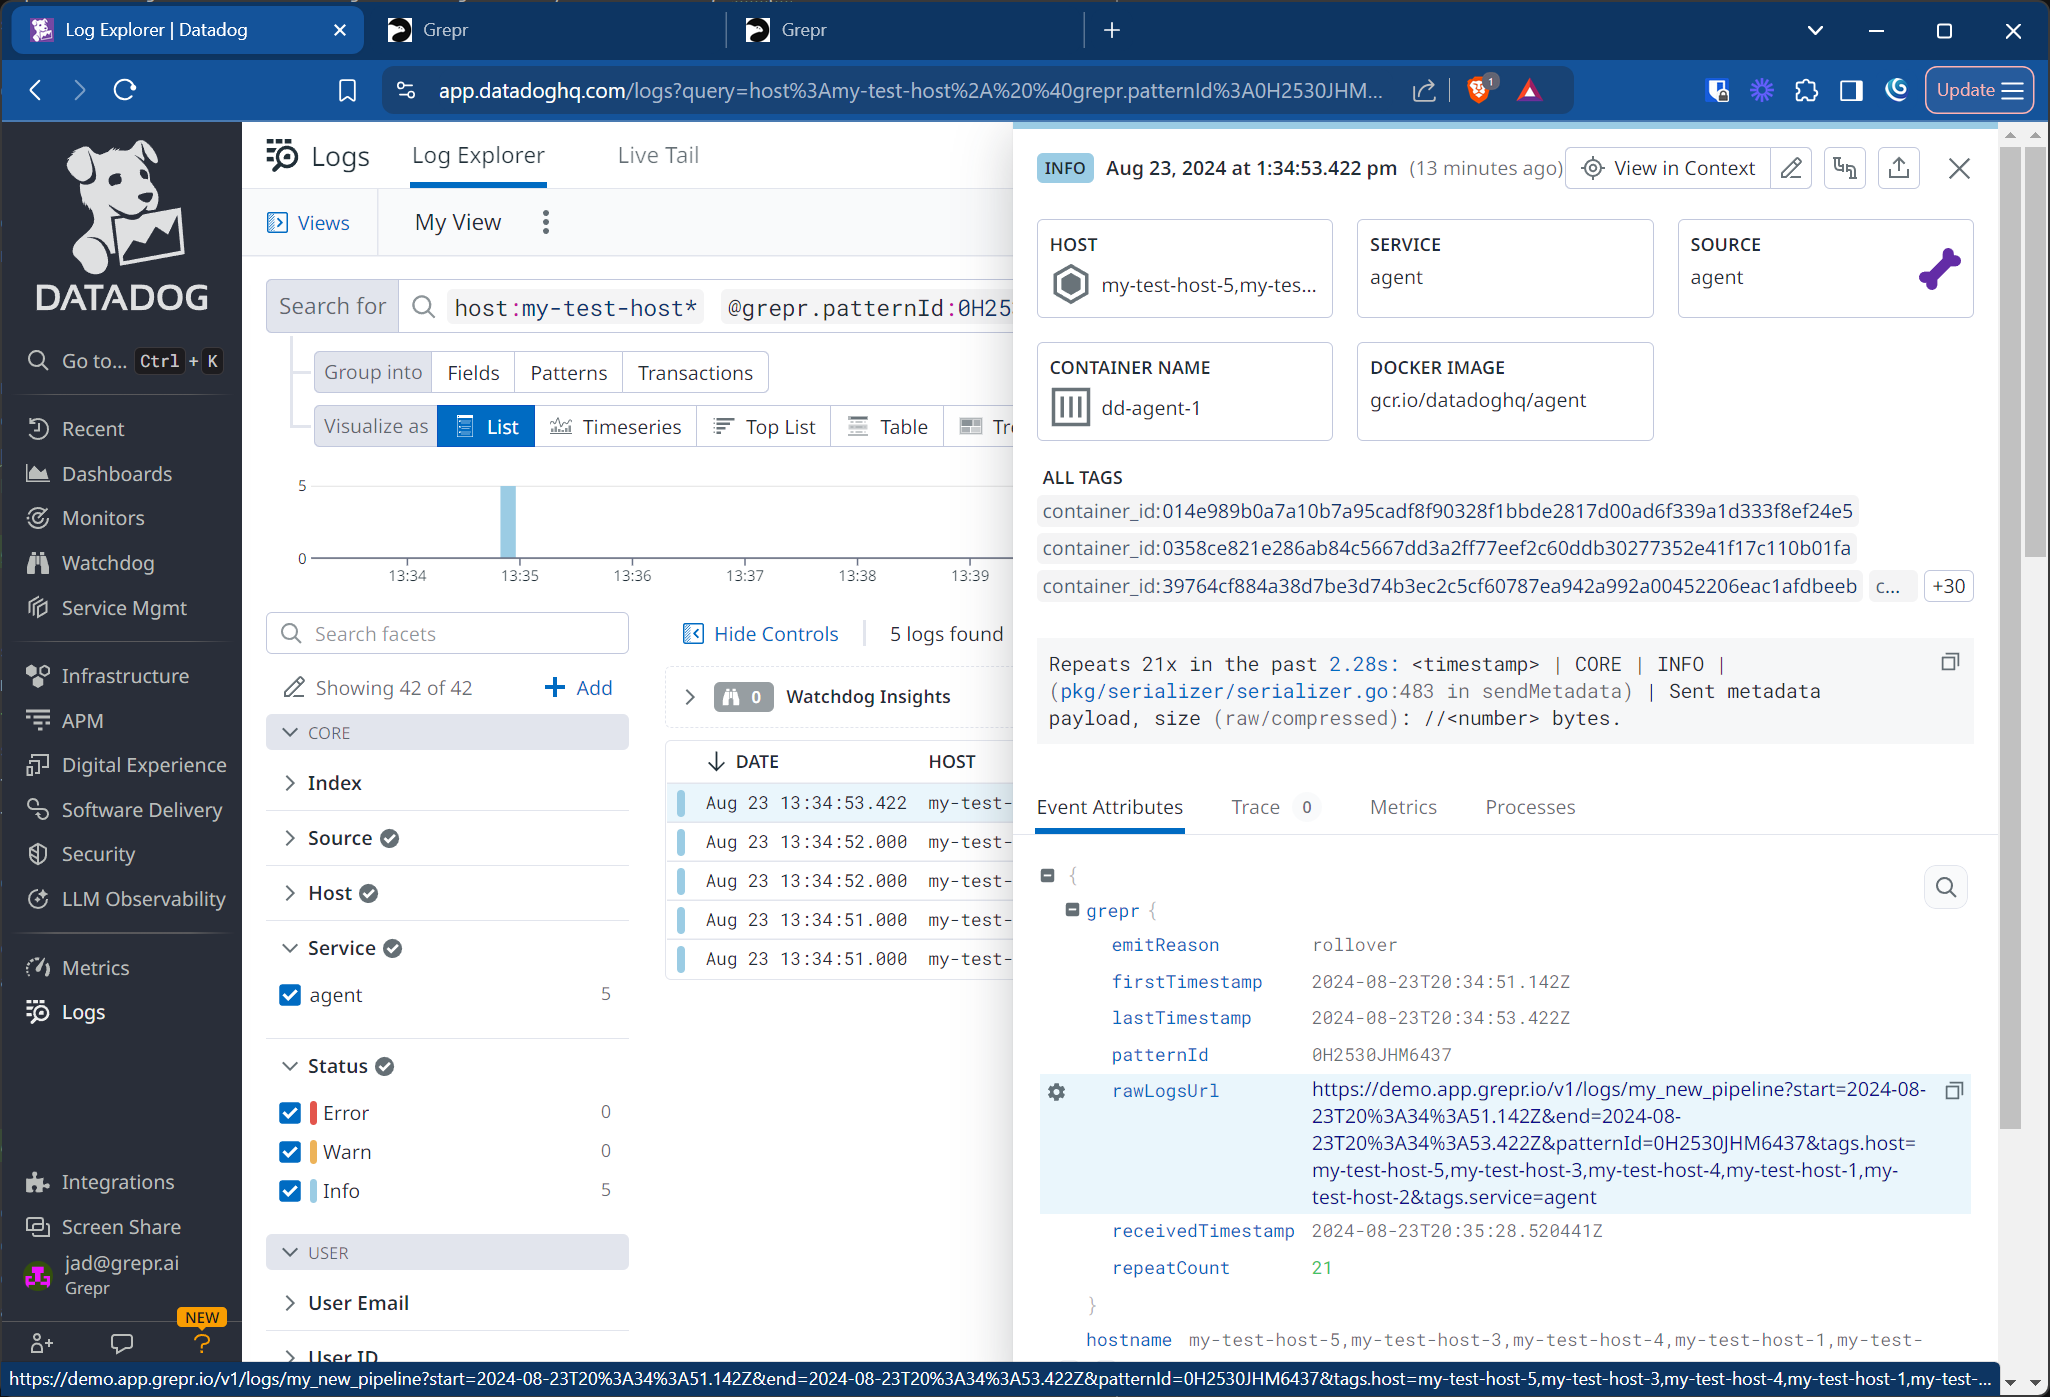
The Grepr Data Explorer opens and displays the results of a search for the raw messages belonging to the same hosts, service, and time period as the summarized messages, highlighting all the messages with the same pattern ID.
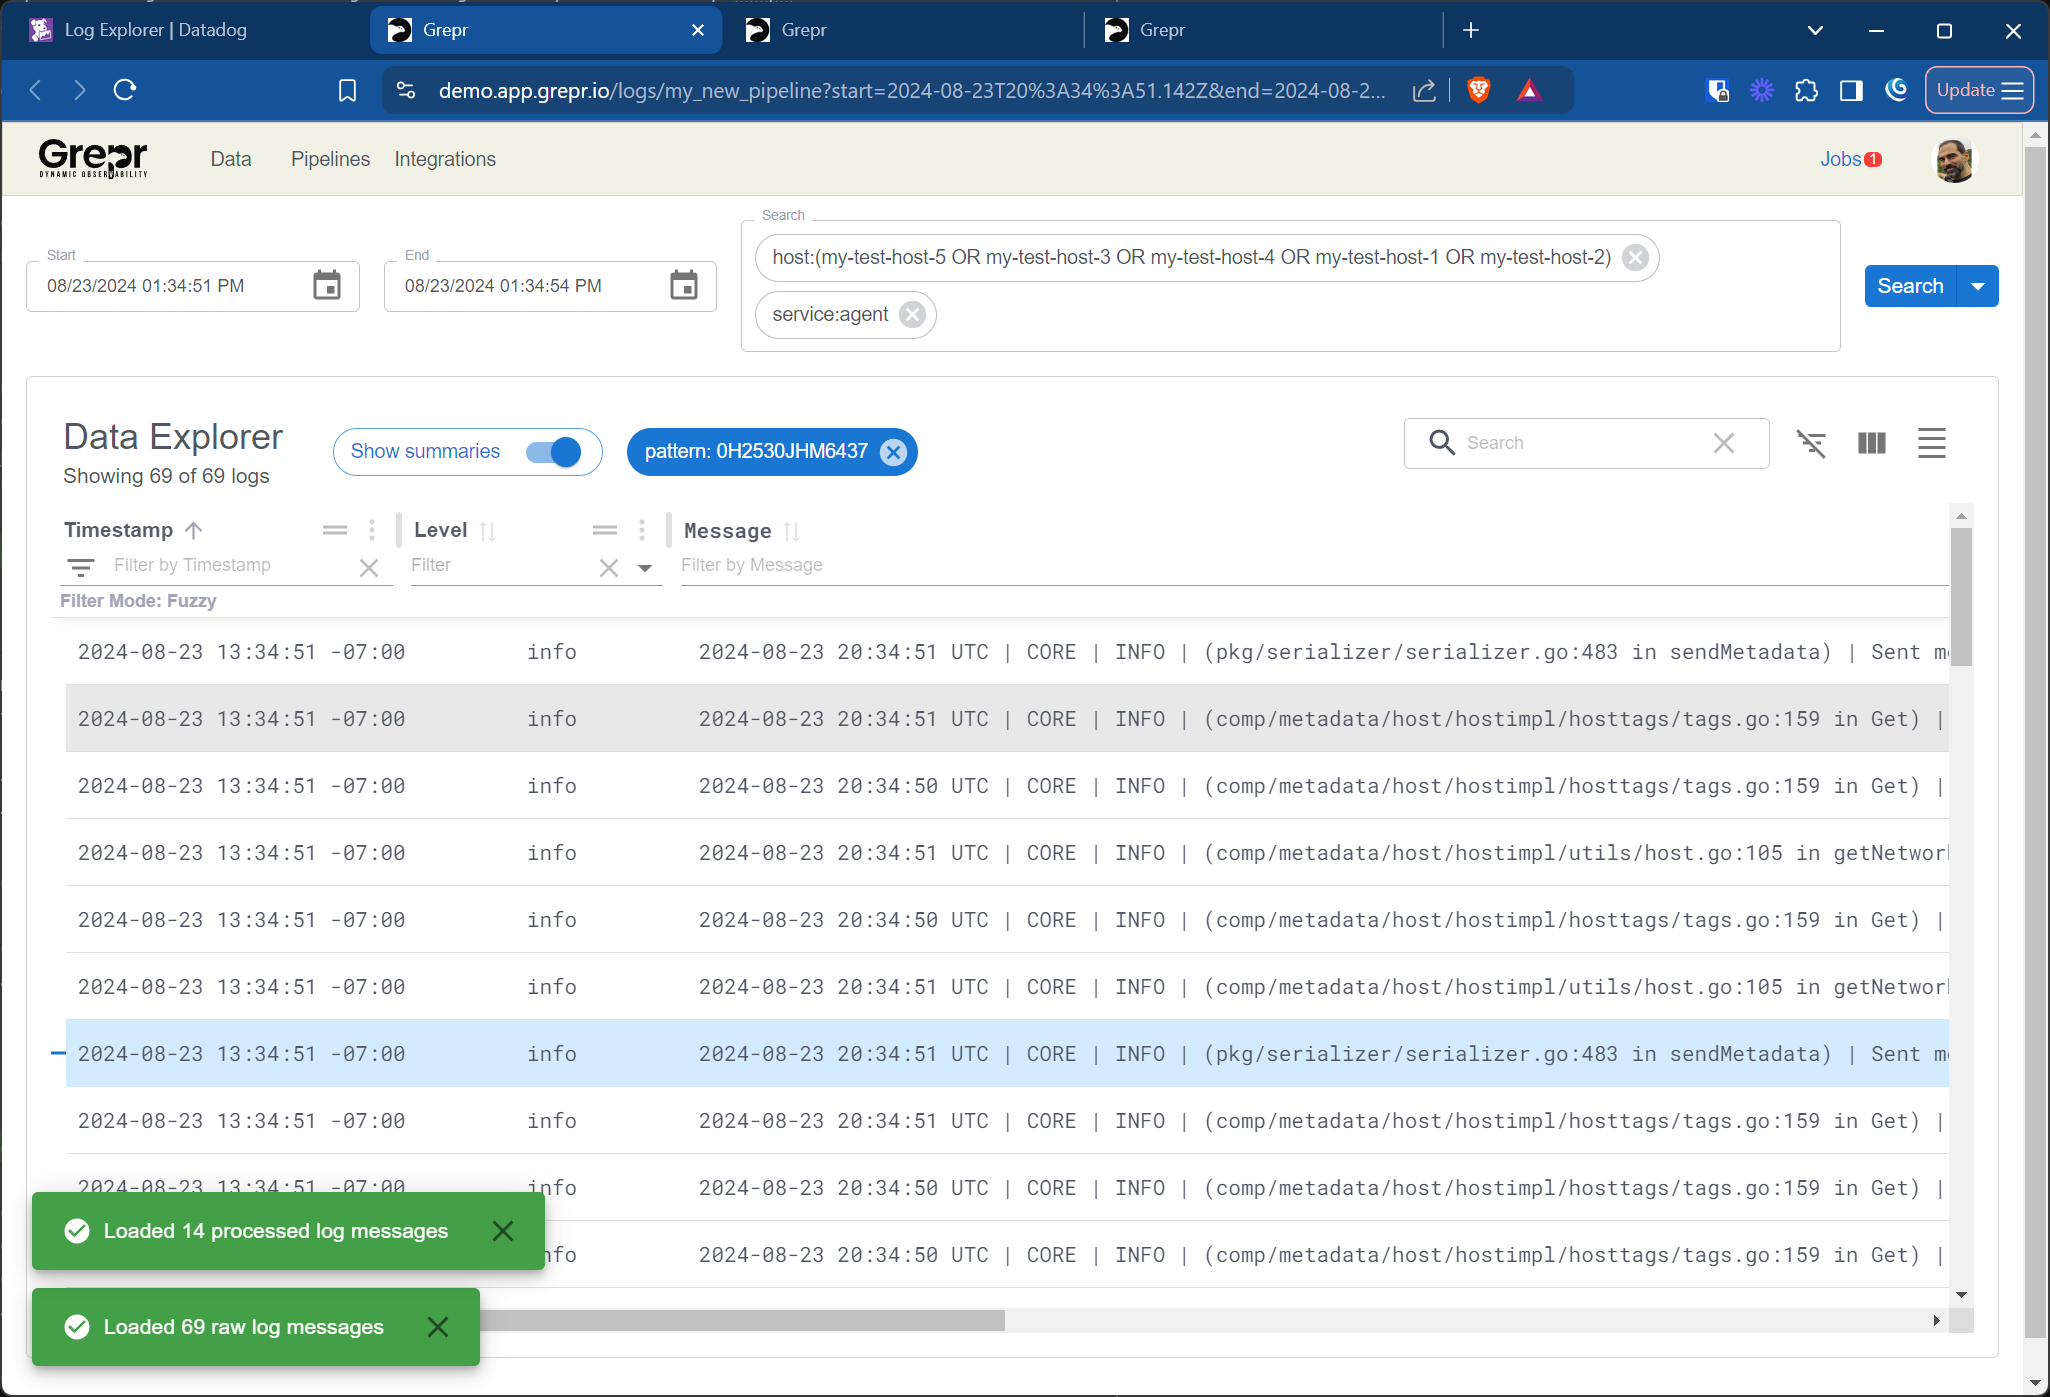
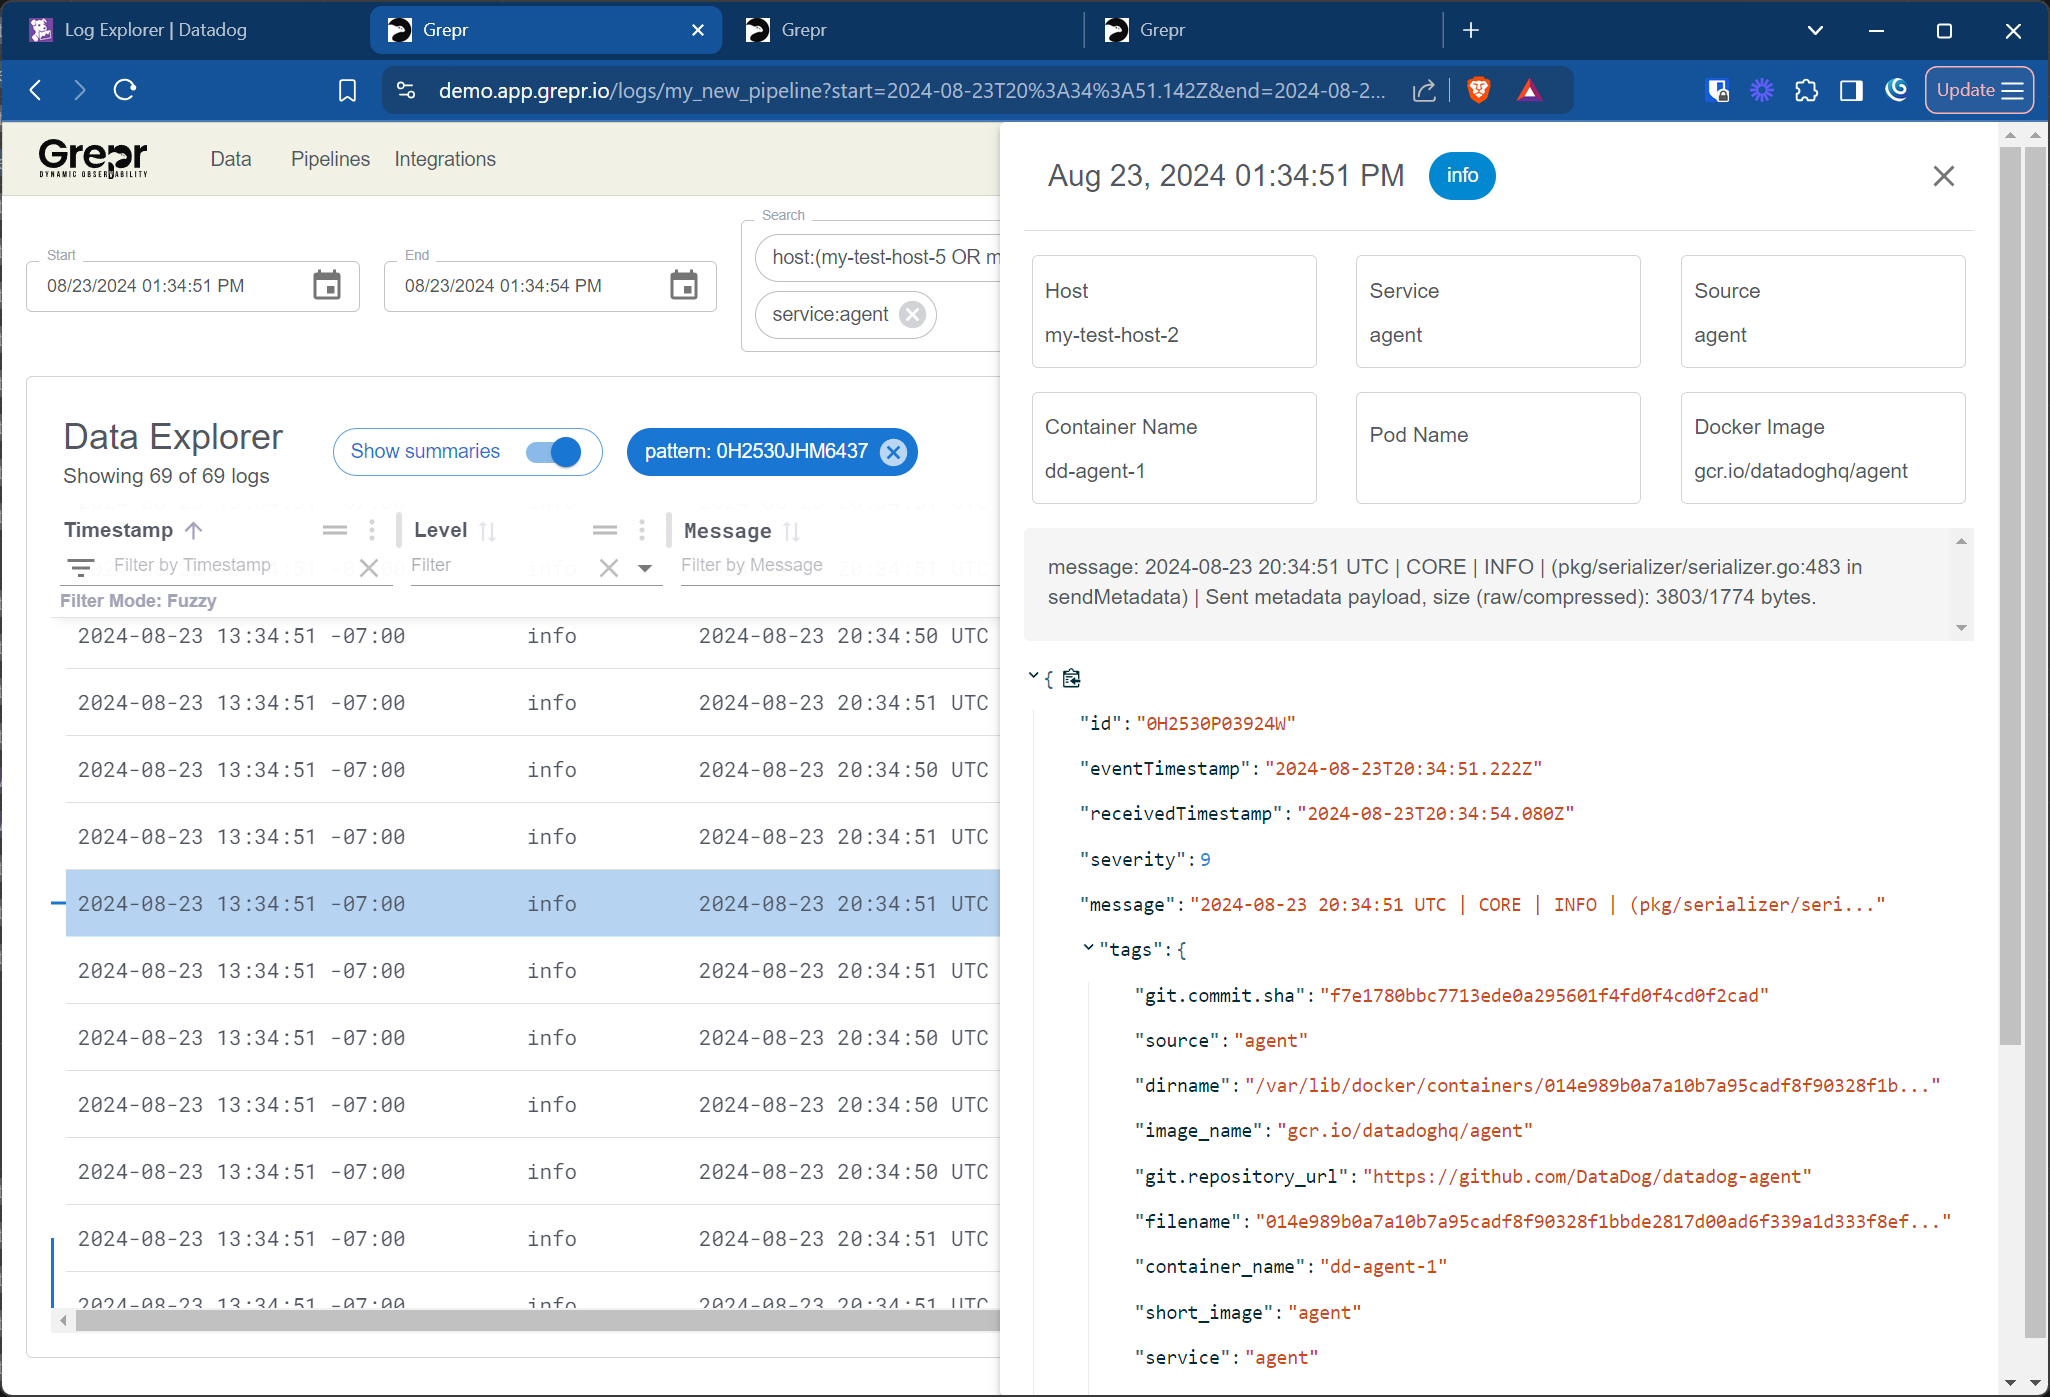
-
To open a side panel displaying the details of a message, click one of the messages.
-
To load all these raw log messages to Datadog so that you can use the Datadog UI to search and analyze them, expand the menu next to Search in the top right of the Data Explorer and select Backfill.
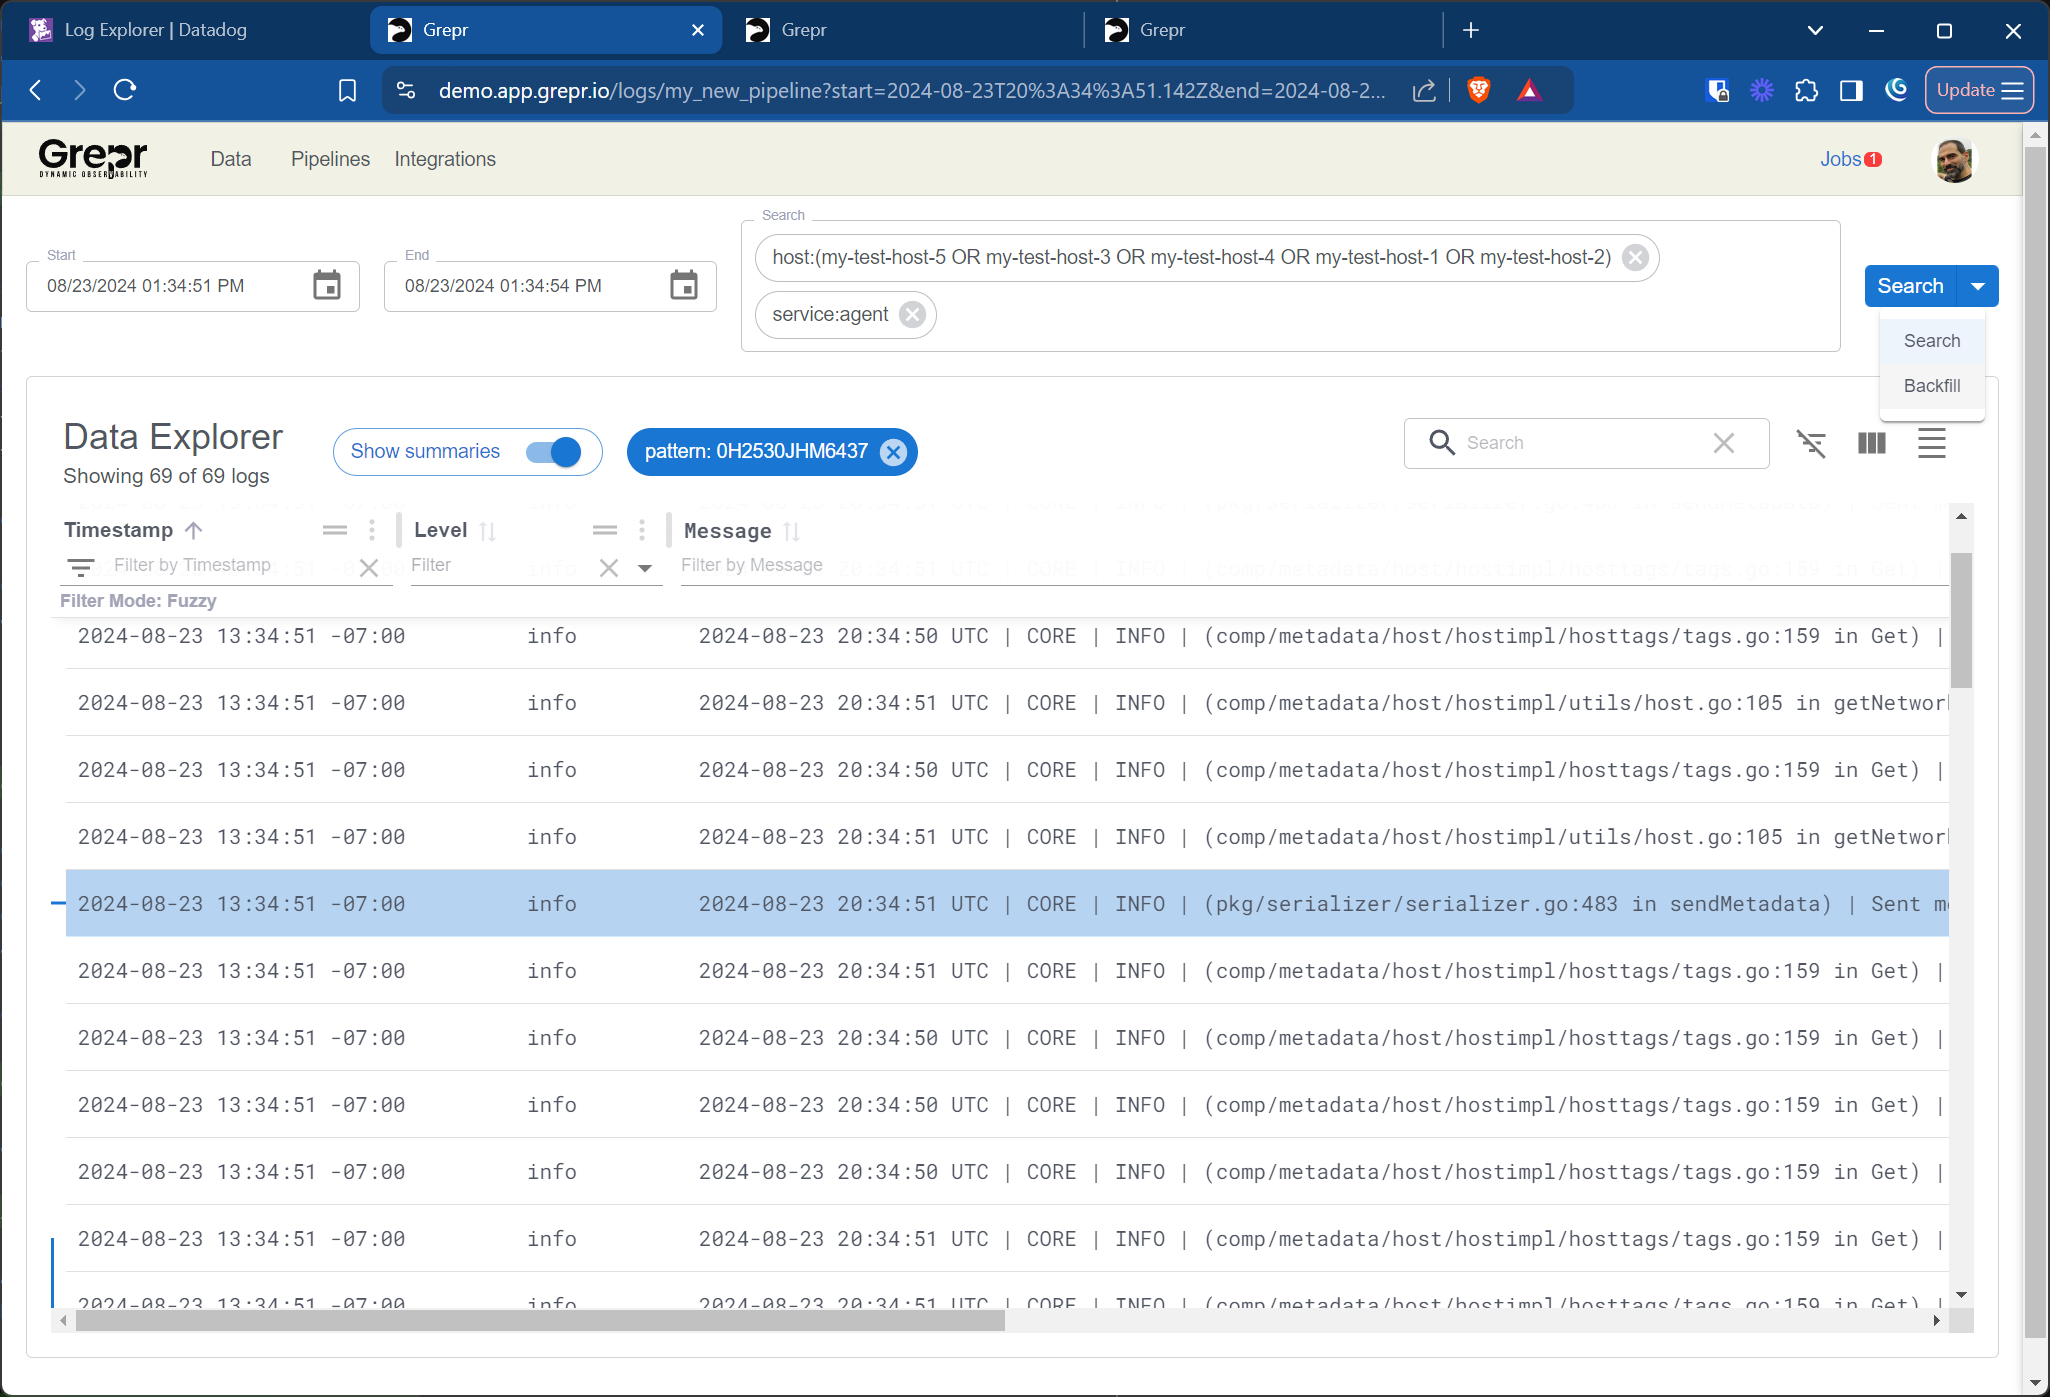
Clicking Backfill starts a Grepr backfill job that loads the raw logs into Datadog. You can see the status of the job by clicking Jobs in the top bar of the Grepr Data Explorer.
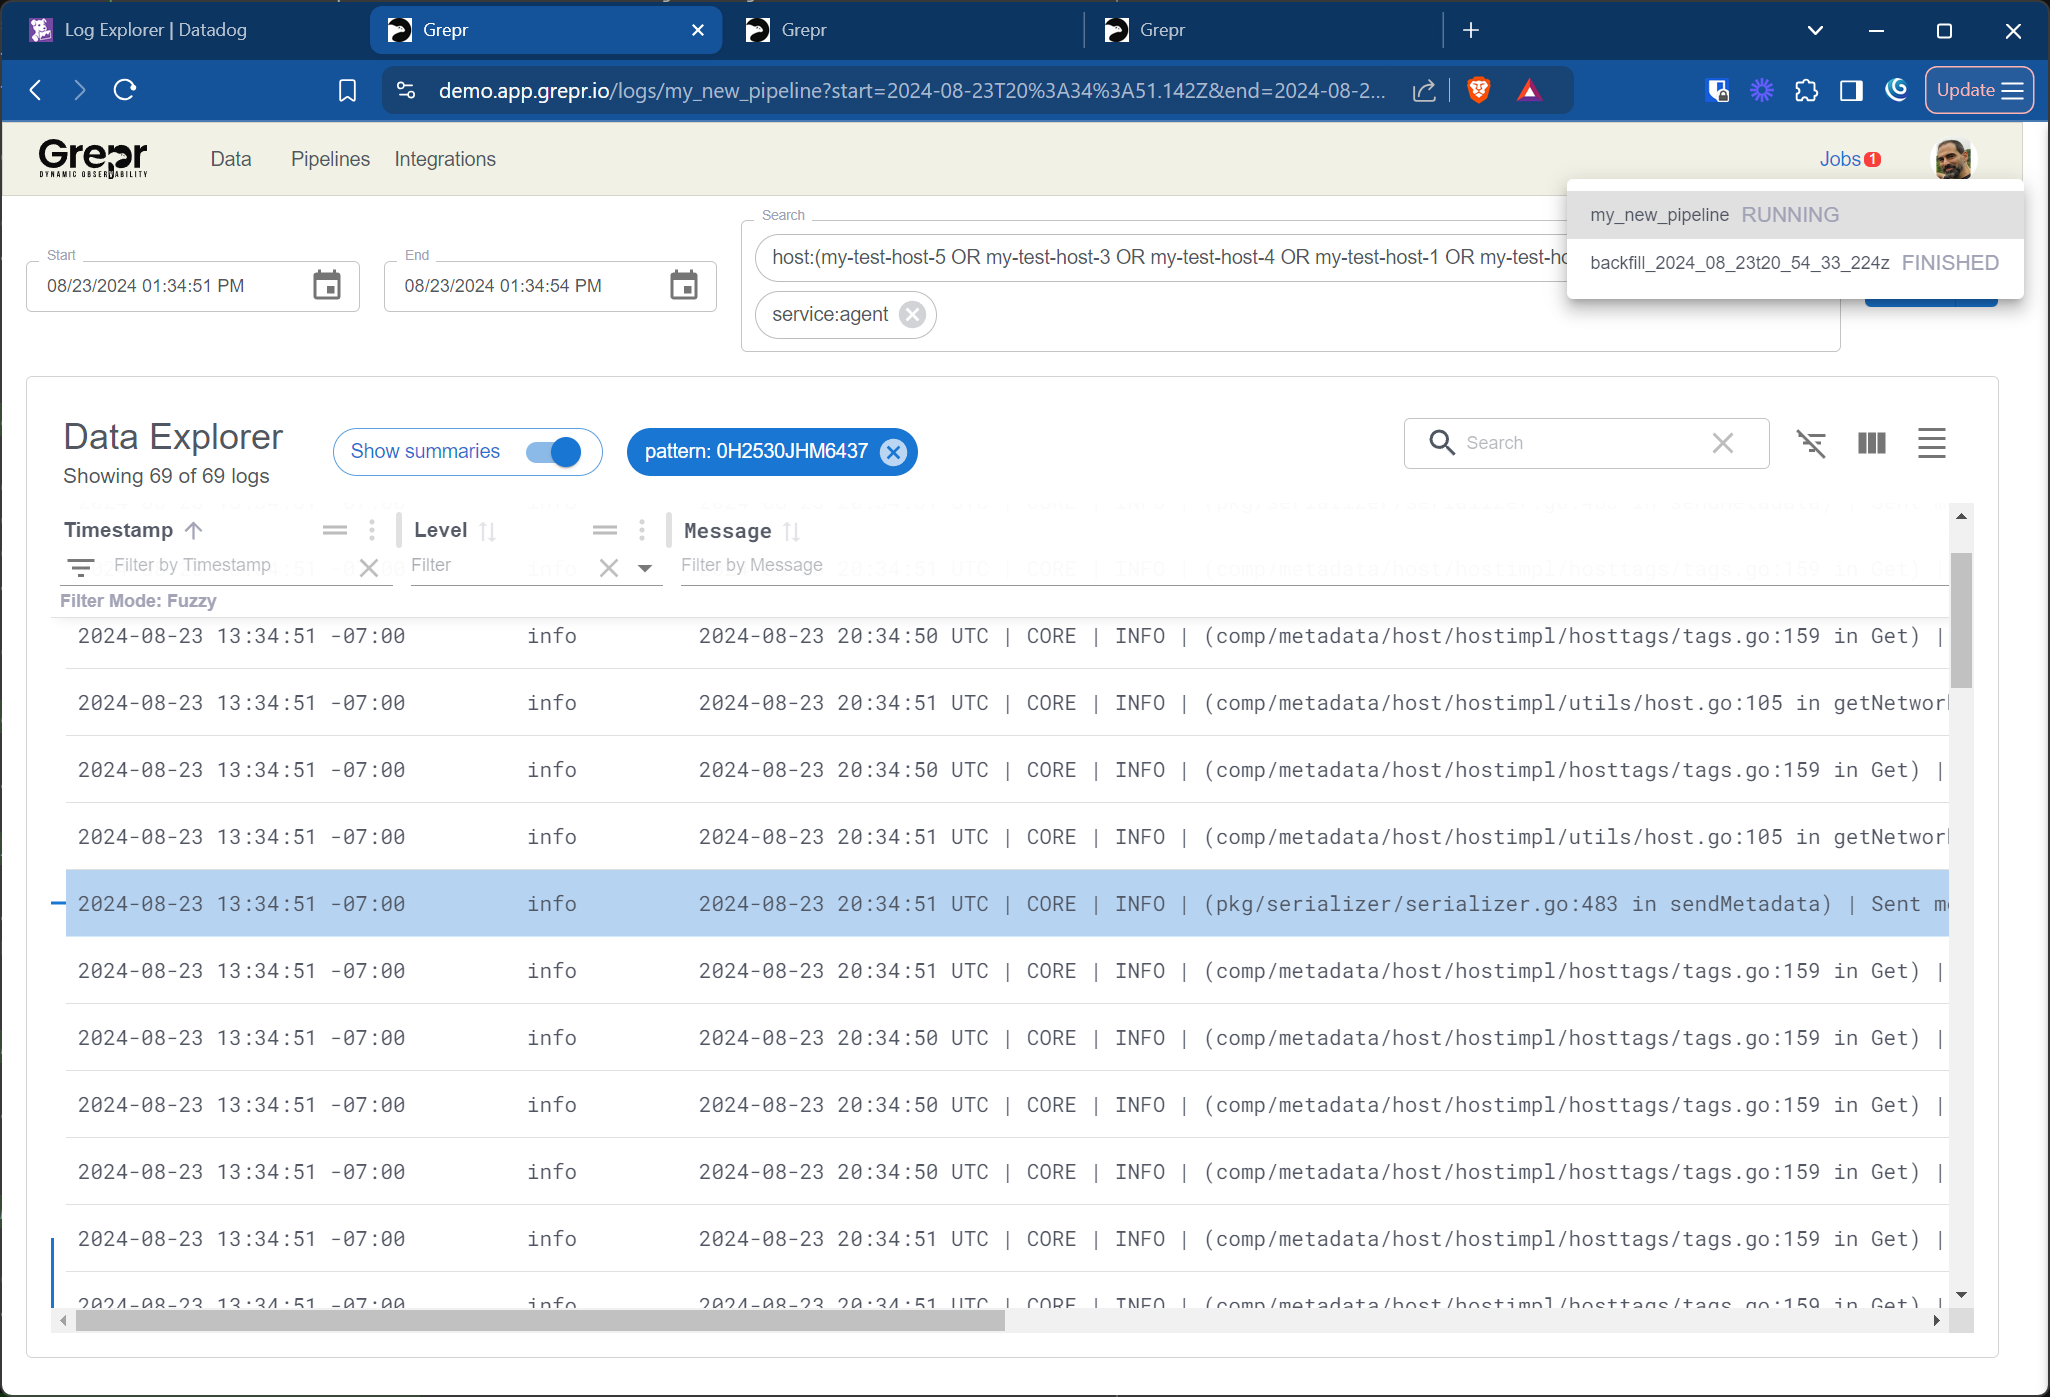
-
To view the backfilled messages in Datadog after the job completes, select the job in the Jobs menu. Selecting the job takes you to the Datadog Log Explorer, where you can view the backfilled messages. Because Datadog needs to index the new messages, there might be a short delay before they appear in the Datadog UI.
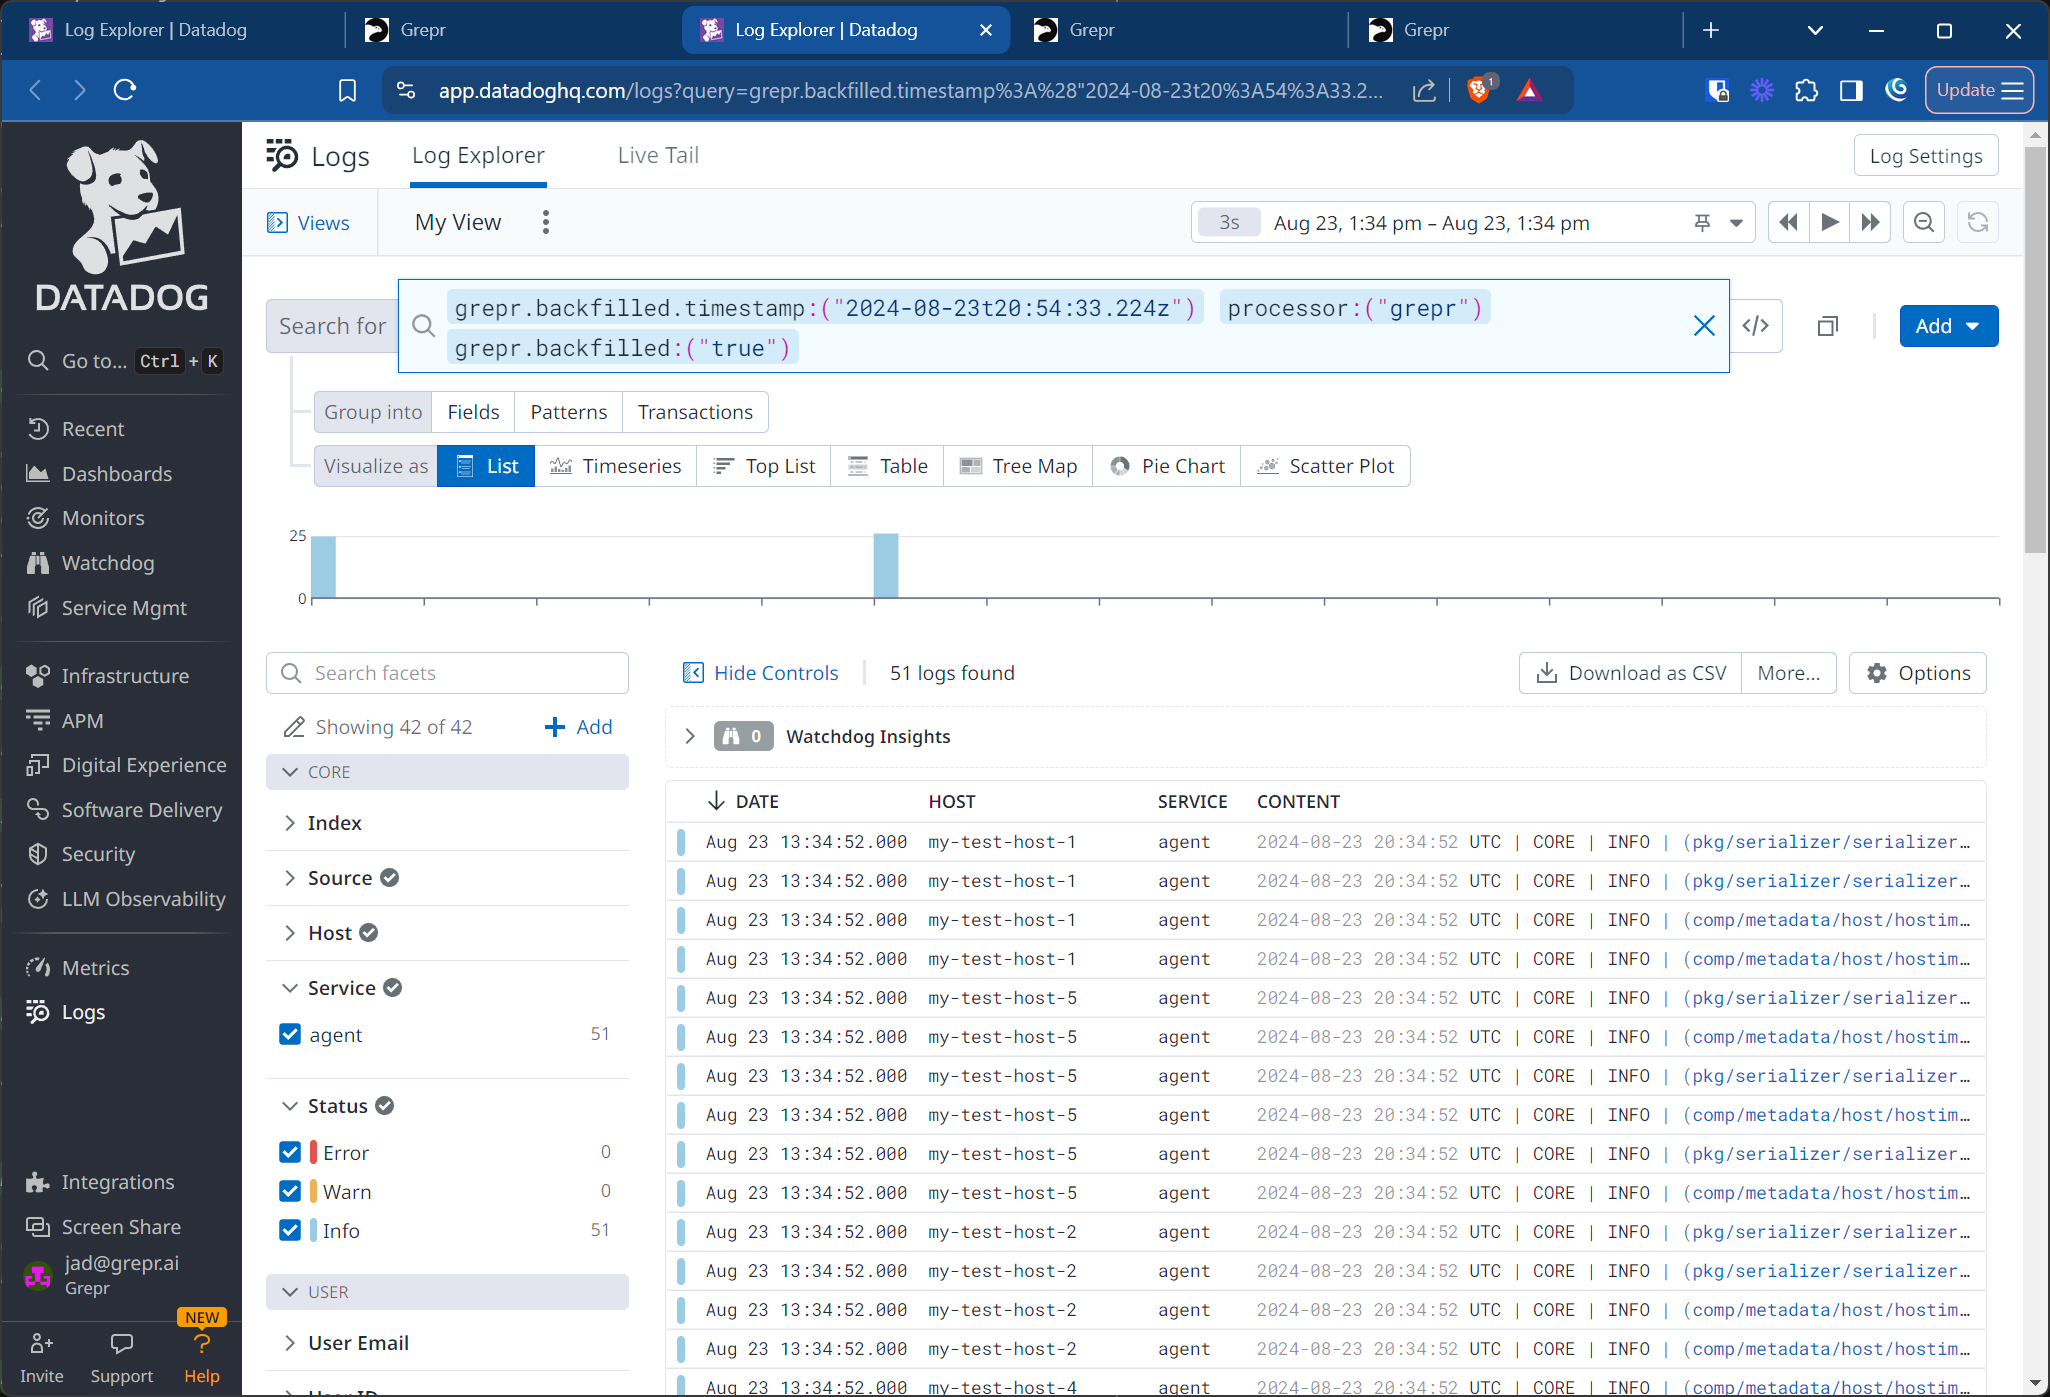
Grepr automatically deduplicates messages when you run a backfill to prevent multiple copies of log messages if you backfill logs across multiple searches.
You can now use the Datadog Log Explorer to search and analyze the backfilled messages.