Bypass aggregation of important messages with exceptions
This page describes how to use exceptions to specify messages that should bypass the reducer and get forwarded directly to your observability platform without summarization. Examples of why you might want to forward raw, unsummarized messages include:
- You need to track activity across messages, requiring samples of all messages associated with specific identifiers.
- You want to provide unsummarized messages for a period before and after an anomalous event occurs or in response to an external event.
- Dashboards, alerts, or monitors in your observability platform depend on receiving full, unsummarized messages to function correctly.
This page explains how to configure the different exception types in the Grepr UI. You can also use the REST API to configure exceptions. With the API, you configure exceptions as part of the LogReducer transform, and then include them as vertices in the job graph defining a log pipeline.
Configure exceptions in the Grepr UI
You configure exceptions on the overview page when you create or edit a pipeline. To add an exception, in the left-hand navigation menu, click Exceptions to open the exceptions list, click Add, and then select the exception type to configure. The following sections describe the different exception types and their configuration options.
To write queries for exception configurations, you use the same syntaxes you use for queries in the filtering or transformation steps of your pipeline. To learn more about supported query syntaxes, see Query log data in the Grepr data lake.
To edit an existing exception, click the exception’s row in the list to open the Edit Exception dialog. To remove an exception, click the delete icon in the exception row.
Prevent aggregation of messages used in your observability platform
Some Grepr integrations, such as Datadog and New Relic, support parsing queries used by monitors, dashboards, or alerts in your observability platform. To ensure the correct functioning of your observability platform assets, Grepr can use the parsing results to configure queries that should automatically bypass reduction. You can choose to apply exceptions for any or all of the parsed queries. To configure parsed queries to use as exceptions, select Do not aggregate logs used in existing observability alerts to display the Imported Queries table. Use the links in the Name column to go to the alert’s source in your observability vendor’s UI.
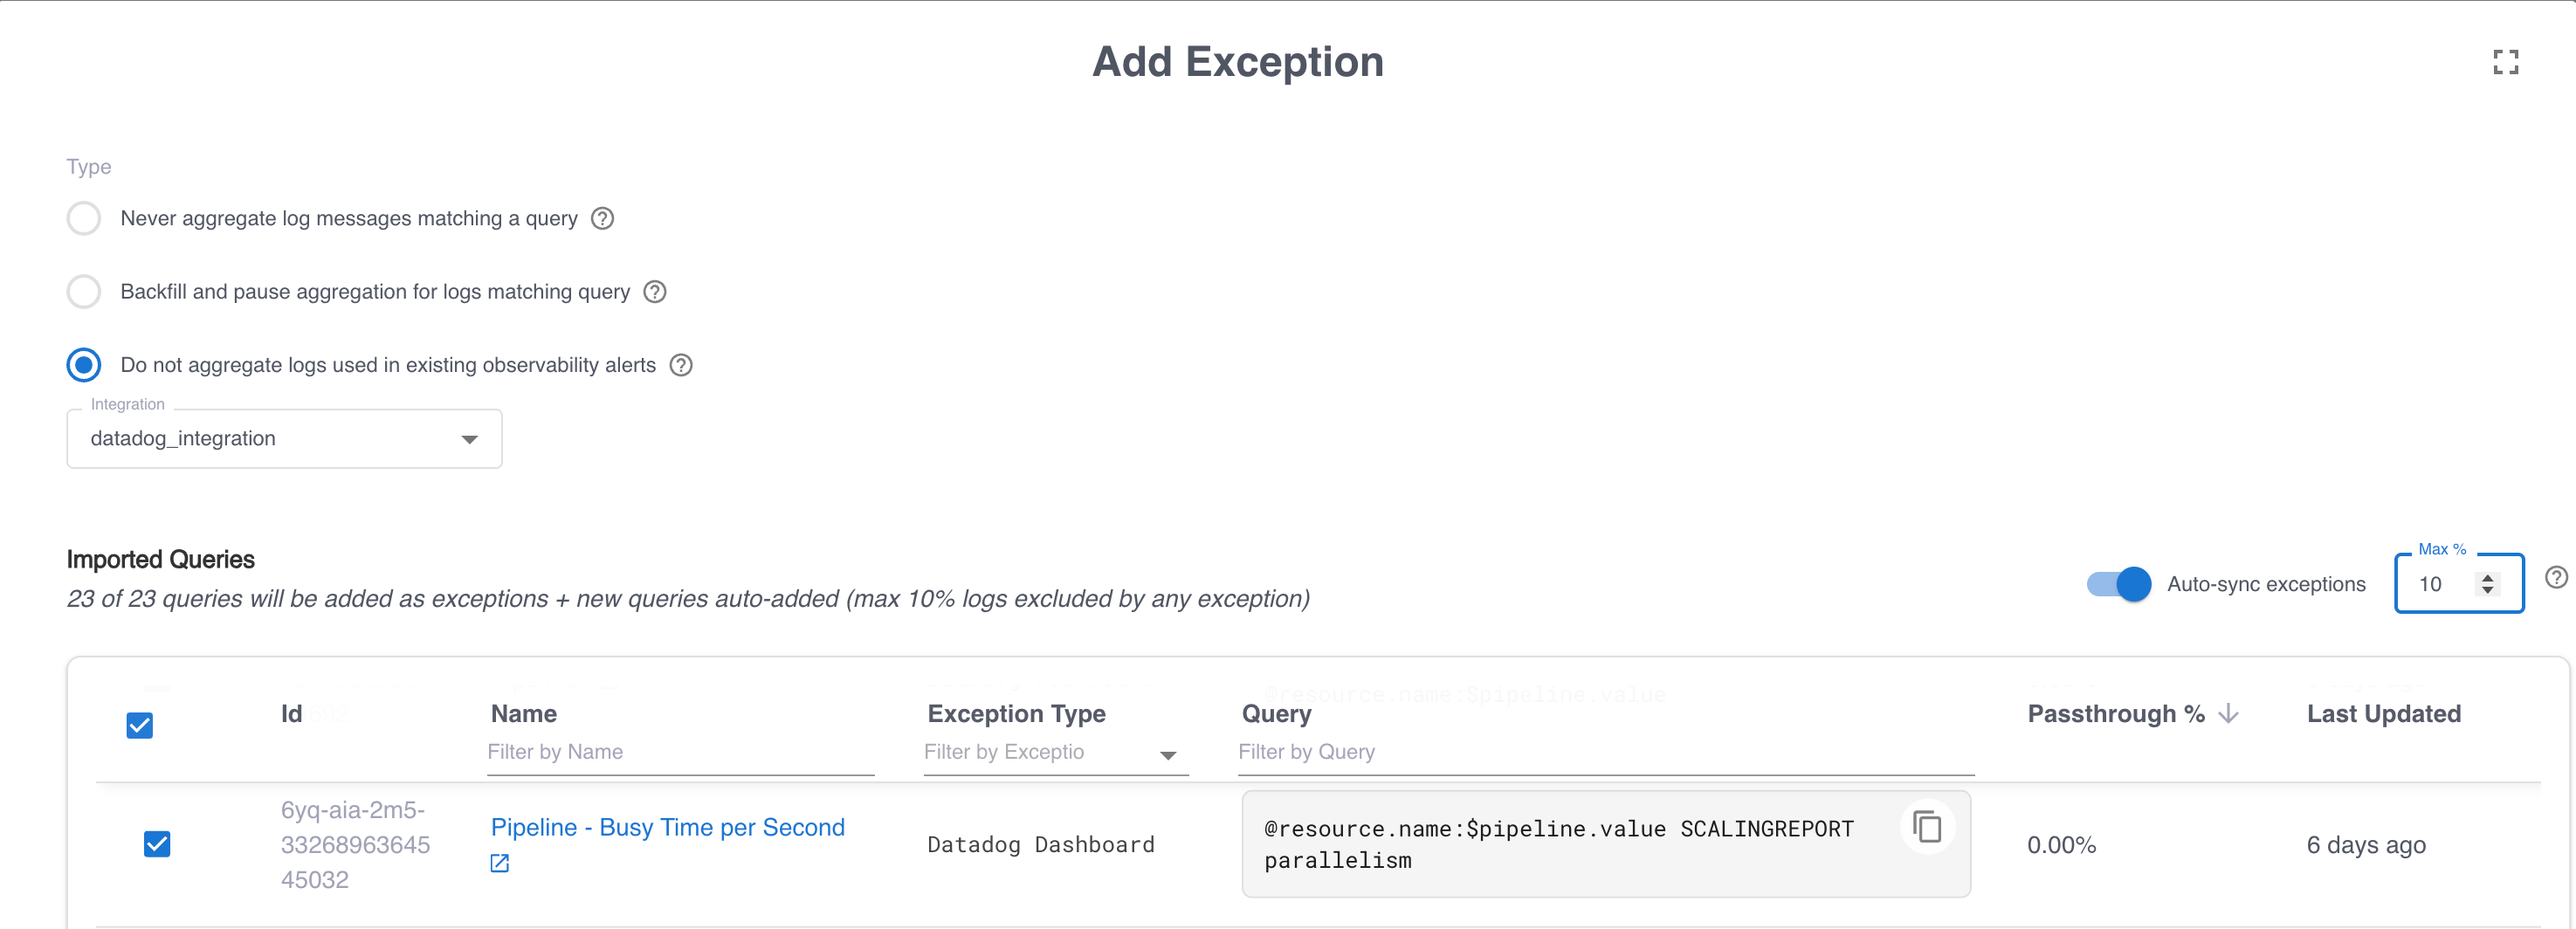
The Imported Queries table also includes the Passthrough % column, which is an estimate of the percentage of events over a configurable time window that would bypass aggregation. You configure passthrough estimation as part of the integration configuration. See Identify log events that should bypass aggregation.
You can also enable Auto-sync exceptions to automatically add and remove exceptions as you add and remove alerts or dashboards in your observability vendor. When you enable auto-sync and no queries are selected in the Imported Queries table, all queries are selected automatically as exceptions. If at least one query is already selected, that selection is retained, and you must manually select any other queries to include. In both cases, Grepr automatically adds exceptions for any new queries parsed after enabling auto-sync.
When you enable auto-sync, changes such as new alerts or dashboards in your observability platform might cause an unexpectedly large increase in the log events that bypass reduction. To mitigate this risk, you can set a threshold for auto-sync exceptions. The threshold setting prevents auto-sync from adding a new exception when the estimated percentage of log events excluded from reduction for that exception exceeds the threshold. To set this threshold, enter the value in the Max % text box.
If you rewrite alert or dashboard queries to use summarized messages, add processor:grepr to the new queries so that they do not match logs that did not go through Grepr. This tag is automatically added to all log messages that Grepr sends to external vendors and never matches any raw messages. It tells Grepr that a query for an alert or dashboard has already been rewritten.
Always forward messages matching a query
To ensure that certain messages always bypass the reducer and are forwarded without aggregation, for example, when processing in your observability platform has a dependency on those messages, you can define a query to identify those messages. The reducer evaluates every incoming log message and forwards every matching message unmodified. This exception type doesn’t trigger a backfill or affect the aggregation of other messages.
Forward samples of full logs based on trace identifiers
You can ensure you have samples of full logs for events that share a trace identifier. For this exception type, a trace refers to one or more values used to group related events, and not specifically an application performance monitoring trace. For example, a trace ID could be a request ID, a user ID, or a session ID.
Based on the configured trace ID for each log message, Grepr samples a configurable percentage of trace IDs and forwards every log message that belongs to a sampled trace unmodified. Use this exception type to keep a representative sample of complete, end-to-end traces in your observability backend.
Grepr uses the trace samplers in the order they are specified. After a message matches for trace sampling, it is not evaluated against any remaining trace samplers.
Configure the following settings:
- An optional query that scopes the sampling to messages that match the query. Only messages that match the query participate in trace sampling. Leave the query empty to apply sampling to all messages that pass through the reducer.
- Attribute paths or tag keys to use as trace identifiers. To add the paths or keys, click the plus (+) icons. To enter attribute paths, use dot notation, such as
trace.id, or a JSON array, such as["trace", "id"]. Use a JSON array if any segment of the path contains a literal dot. To remove a path or key, click the delete icon next to the entry. - A sample percentage of distinct trace IDs to sample, from 0 to 100. You can specify up to two decimal places, such as
1.50. Grepr forwards every log message whose trace ID falls within the sampled percentage. The default is1.00.
You must specify at least one Trace ID Attribute Path or Trace ID Tag Key. The form does not allow you to save the exception when both lists are empty.
Pause aggregation and backfill logs for events matching a query
You can create an exception that automatically pauses aggregation of specific messages and optionally forwards full messages for a configured period when incoming events match a query. Use this exception type to forward full logs when specific events occur, such as production incidents or other anomalous events. For example, you can configure the query status:error to ensure you have full logs if an event arrives from a host with an error status.
In addition to the query that triggers this exception, you also configure:
- An optional list of attribute paths or tag keys that scope the backfill and the paused aggregation to the values found in the triggering message. For example, if you add
service, only messages with the sameservicevalue as the triggering message are backfilled and excluded from aggregation. - The duration of historical data to backfill from the data lake when the exception is triggered. You can also choose to skip the backfill step and only pause aggregation.
- The duration to pause aggregation of matching messages after the exception is triggered. You can also choose to continue aggregating matching messages and only run the backfill.
Pause aggregation and backfill logs in response to an external event
In addition to triggering exceptions based on incoming log messages, you can configure exceptions to be triggered by external events. This exception type is activated when an external system, such as an observability monitor or alert, calls the External Triggers endpoint.
Configure the following settings:
- An optional list of attribute paths or tag keys that scope the backfill and the paused aggregation to the values passed in the call to the external triggers endpoint. To add an attribute, type
@and then select from the suggested values. - The duration of historical data to backfill from the data lake when the exception is triggered. You can also choose to skip the backfill step and only pause aggregation.
- The duration to pause aggregation of matching messages after the exception is triggered. You can also choose to continue aggregating matching messages and only run the backfill.
The attributes and keys you define are included as key-value pairs in the variables object in the body of the request to the external triggers endpoint. After you save the exception, click the terminal icon in the exception’s Actions column to display a sample curl command to call the external triggers endpoint for that exception. After updating the placeholders for values in the variables object, you can use this command for testing and as a reference when configuring calls to the trigger from an external system.
Rewrite queries
When you first deploy Grepr’s log reduction, you typically add exceptions for all existing alerts and dashboards to minimize disruptions to existing workflows. However, over time, you might find that some of these alerts and dashboards use queries that count the occurrence of a pattern that appears with high frequency. For example, you might have a dashboard that uses a count of HTTP requests with the status code 200. Because 200 is the standard success status code, most HTTP log messages include it. Adding an exception for this dashboard results in forwarding a large number of events that would normally be aggregated.
To address this, you can rewrite the query to use the grepr.repeatCount attribute. This attribute appears in both summary and sample messages, enabling the derivation of metrics. See your vendor’s documentation for specifics on creating a metric from a log attribute.