Reduce noise and improve the usability of your logs with the log reducer
Grepr’s log reducer uses clustering algorithms and real-time pattern discovery to identify repeated messages in high-volume log streams and aggregate those messages into summarized events. These summarized events reduce the volume of redundant, low-value log events while retaining full context for less common and often higher-value events.
The log reducer is a core step in a Grepr log reduction pipeline, where it runs after log events have been processed by the parsing, filtering, and transformation steps and before they are sent to your configured sinks. By sending summarized events rather than the full set of logs to your observability vendor, Grepr significantly reduces the volume of shipped logs and your observability costs.
Messages that do not match any pattern pass through unmodified. You can also configure exceptions for specific messages or patterns that must bypass the reducer and be forwarded unmodified to your observability platform. See Bypass aggregation of important messages with exceptions.
Log reduction pipelines also persist your unaggregated raw logs in a Grepr data lake, ensuring you maintain full access to your log data while dramatically reducing storage and processing costs. The data lake allows you to query and analyze your raw logs, for example, when an incident occurs or alerts are raised that require access to the full set of logs for troubleshooting or debugging. See The Grepr data lake.
When you create a log reduction pipeline, a reducer is added with default settings suitable for many log processing flows. When needed, you can change the configuration settings to meet your requirements. You can modify reducer settings in the UI or through the Grepr REST API. To configure the reducer in the UI, see Configure the log reducer in a Grepr pipeline. For API documentation, see the LogReducer API specification.
How log reduction works
The log reducer divides incoming log events into fixed-duration, tumbling windows and produces summaries separately for each window. The reducer creates the summarized events through a multi-step process, including transformations to:
- Normalize fields to help group values that represent the same entity but might differ slightly in format or content.
- Structure messages to optimize grouping.
- Group messages using similarity metrics.
- Output a configurable number of raw sample messages per pattern before summarizing additional matches.
- Create and output a concise summary of aggregated messages that match an identified pattern along with a configurable sample of raw messages. The summarized events include metadata that provides important context about the aggregated messages and preserves important fields. See Summary message metadata.
- Add a tag to all output events to indicate whether the type of message it contains is a sample, summary, passthrough, or exception. See Message types.
If the reducer cannot find a matching pattern for a message, the message passes through unmodified. Reasons that the reducer cannot find a pattern include:
- The clustering process is unable to extract patterns from messages.
- The log message field is empty or null.
- The message matches a configured exception rule that prevents it from being reduced.
To learn more about the transformations the reducer applies to messages and how to modify its default behavior, see Configure the log reducer in a Grepr pipeline.
Example: Summarizing repeated and low-value messages
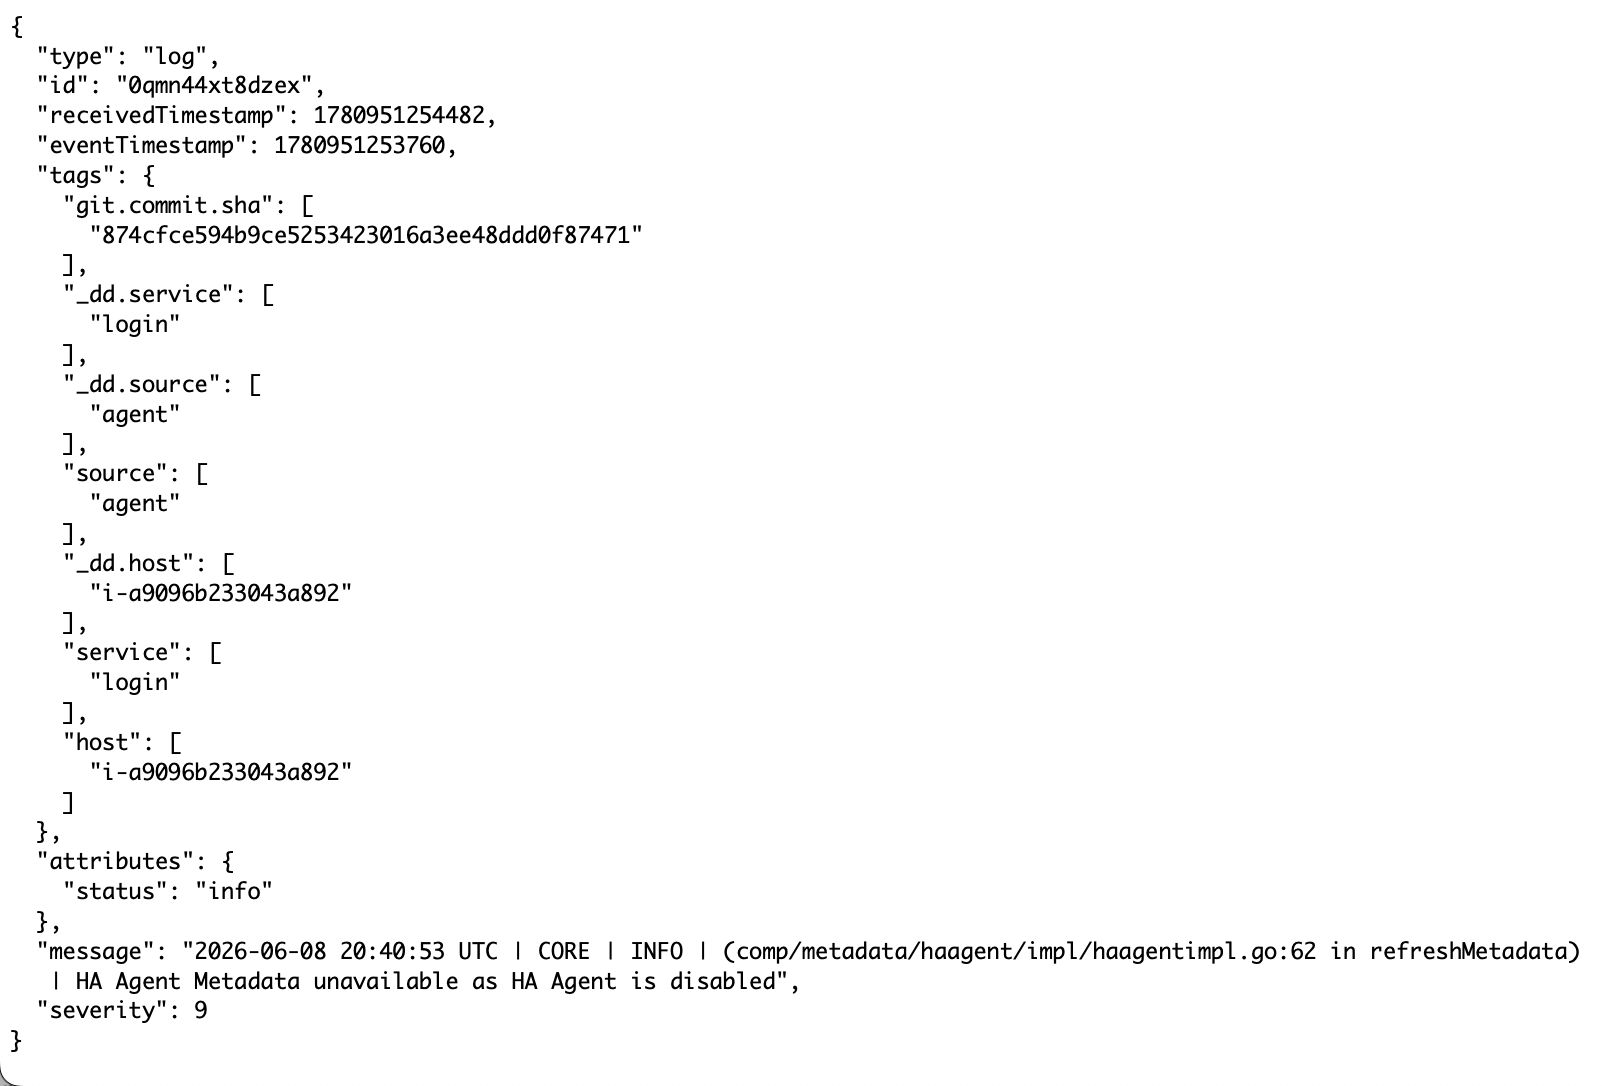
The following image shows an example of a message that’s logged repeatedly but provides little to no value because the service it reports on is intentionally left non-running.
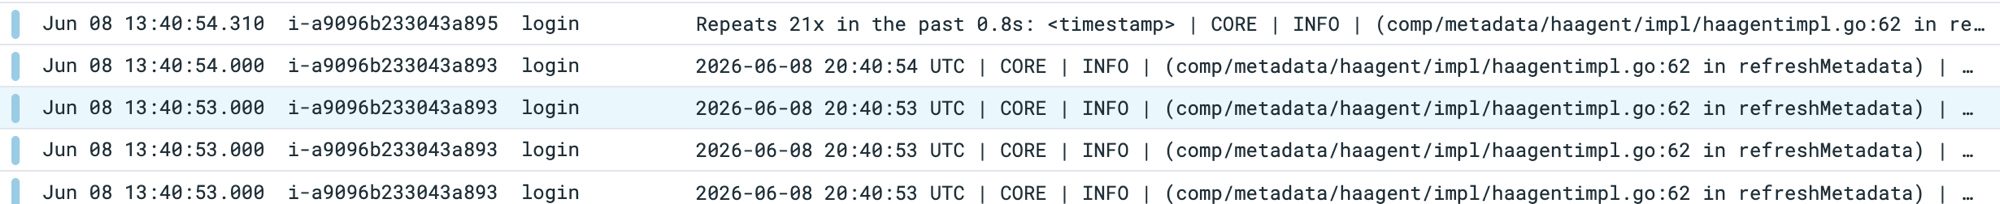
The log reducer identifies the pattern in this message and summarizes it into a single message indicating how many times the original message was logged. The summary also includes other metadata about the pattern and the messages that matched it. Important fields from the original messages are included in the summary. The reducer then outputs this summarized message and a sample of the raw messages.
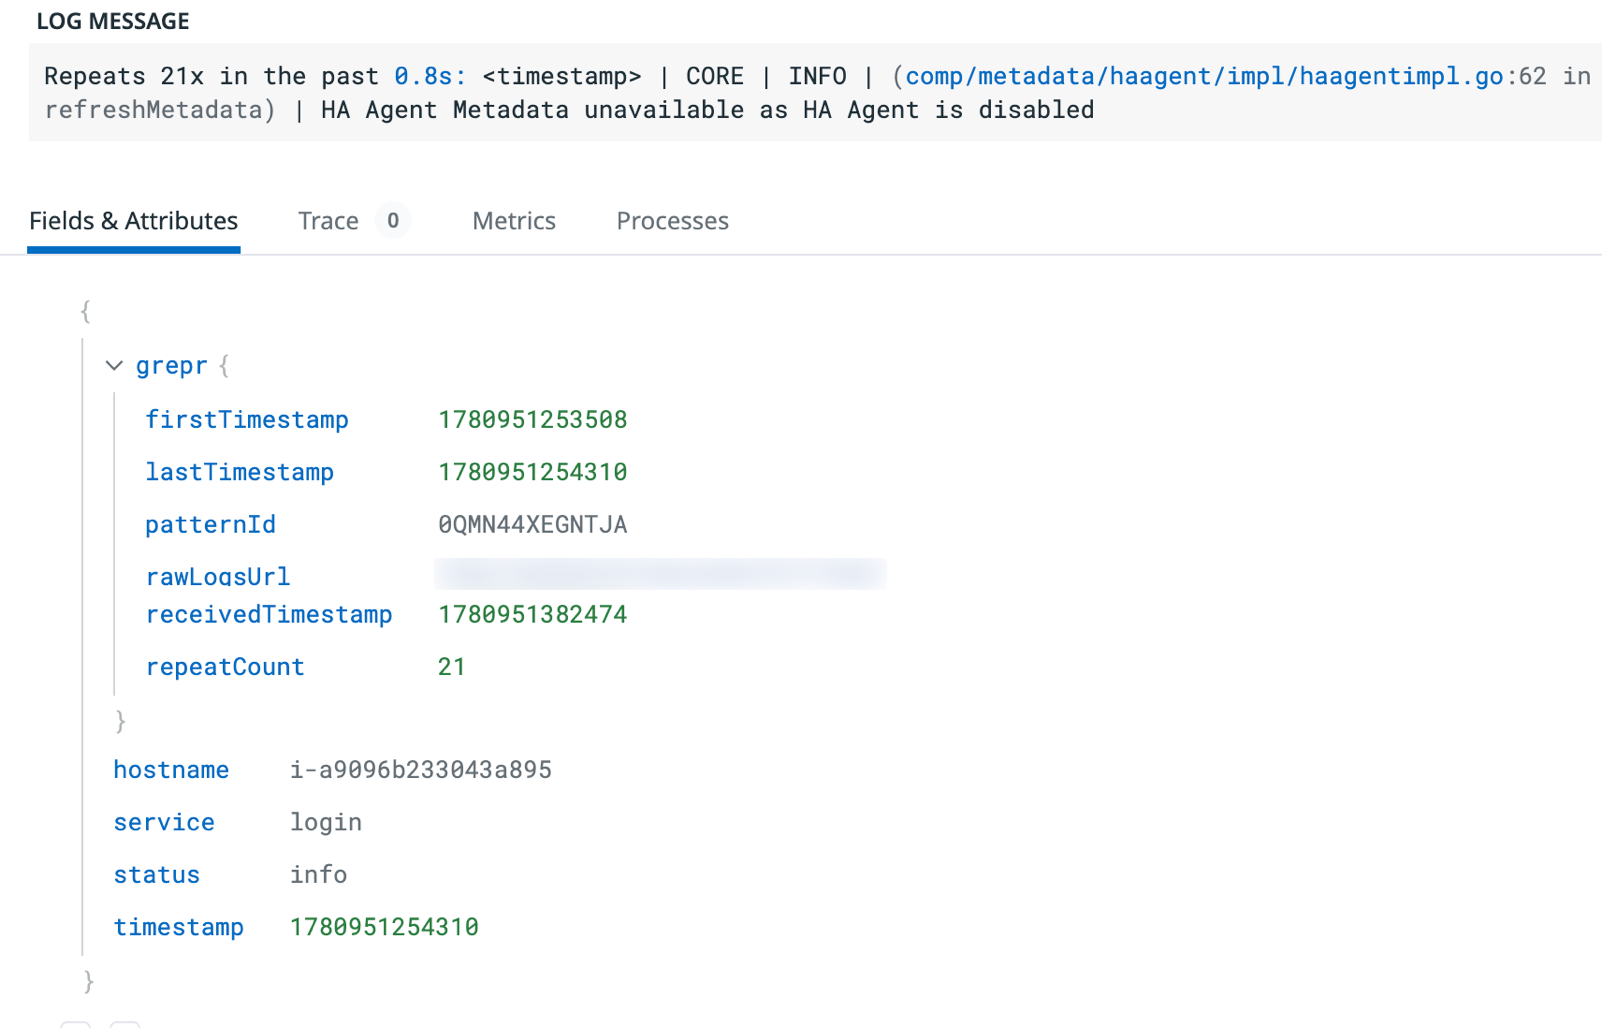
Viewing the summary message shows the added metadata, such as the number of times the message was logged and the start and end times of the messages that were summarized.
Summary message metadata
When the reducer generates a summary message for a pattern, it adds the following metadata fields to the output event that provide important context about the aggregated messages. This metadata allows you to understand the pattern’s characteristics and the messages it represents, and to link back to the original raw messages if needed.
| Field | Description |
|---|---|
grepr.patternId | Unique identifier for the pattern. Use this to find related messages. |
grepr.rawLogsUrl | A direct link to view all raw messages for this pattern in the Grepr data lake. |
grepr.repeatCount | The number of input messages included in the summary. This can be useful for metrics and rewriting queries. |
grepr.receivedTimestamp | Milliseconds since the Unix epoch when the summary was emitted by Grepr. |
grepr.firstTimeTimestamp | Milliseconds since the Unix epoch of the first message in this summary. |
grepr.lastTimeTimestamp | Milliseconds since the Unix epoch of the last message in this summary. |
Message types
After processing, each record is assigned a message type, and the grepr.messagetype tag is added to output events with one of the following values:
| Value | Description |
|---|---|
sample | The message is a sample of the original log messages that matched a specific pattern. Sample messages are sent through unmodified until the deduplication threshold is reached. |
summary | The message summarizes multiple source log messages that matched a specific pattern. Summary messages are generated at the end of each aggregation window for patterns that have exceeded the deduplication threshold. |
passthrough | The message did not match any existing patterns and was sent through unmodified. |
exception | The message matched an exception rule and was sent through unmodified. |
Next steps
- To modify the reducer’s default settings to provide further control over how messages are processed, see Configure the log reducer in a Grepr pipeline.
- If you have important messages that must be forwarded to your observability platform without aggregation, configure exceptions to ensure these messages skip the reducer step and are forwarded unchanged. See Bypass aggregation of important messages with exceptions.