Configure Splunk connections with a Grepr integration
The Grepr Splunk integration enables you to ingest logs into Grepr using a Grepr source, process the logs with a Grepr pipeline, and then send the processed logs to Splunk using a Grepr sink.
The Grepr Splunk integration supports forwarding data through the following interfaces:
- Splunk’s HTTP Event Collector (HEC): You can use any collector that supports HEC, including Fluent Bit, Fluentd, and the Splunk OpenTelemetry Collector.
- S2S over HTTP: You can forward data from Splunk Universal Forwarders or Splunk Heavy Forwarders using S2S over HTTP. S2S over TCP is not supported.
To send logs to a Grepr pipeline before forwarding them to your Splunk instance, change your collector configuration to send the logs to a Grepr endpoint URL rather than a Splunk HEC or S2S endpoint.
In addition to using a Splunk integration to ingest log data with a Grepr source and send processed logs to Splunk with a Grepr sink, you can also use a Splunk HTTP source to ingest data from a Splunk instance into Grepr for processing. See Ingest log data from Splunk using the Splunk HTTP source.
You can use the Grepr UI or REST API to add a Splunk integration. To learn how to create a Splunk integration in the Grepr UI and configure collectors to send logs to Grepr, see Use a Splunk integration in a Grepr pipeline.
To use the REST API, see the Splunk Integration specification.
Although this page describes using an integration to create a pipeline for sourcing and sending data with a single observability platform, your pipelines can use multiple integrations to source and sink data for different platforms. For example, you can create a pipeline with a Datadog integration that’s used to source data from Datadog agents, and a Splunk integration and sink that sends the pipeline output to Splunk.
Requirements
The Grepr integration for Splunk requires the following:
- An HTTP Event Collector (HEC) token is required for both HEC and S2S. You can create an HEC token in the Splunk platform settings. See Set up and use the HTTP Event Collector in Splunk Web .
- A Bearer token for authentication to the Splunk REST API is required for using a Splunk HTTP source to ingest data from a Splunk instance into Grepr. The user associated with the token must have the
searchandrest_access_server_endpointscapabilities. See Ingest log data from Splunk using the Splunk HTTP source.
For details on creating tokens for the Splunk API, see Create authentication tokens .
Use a Splunk integration in a Grepr pipeline
Use the following steps to create a Splunk integration in the Grepr UI and use it in a pipeline to source and sink data.
Step 1: Create a Splunk integration
To create a Splunk integration in the Grepr UI:
-
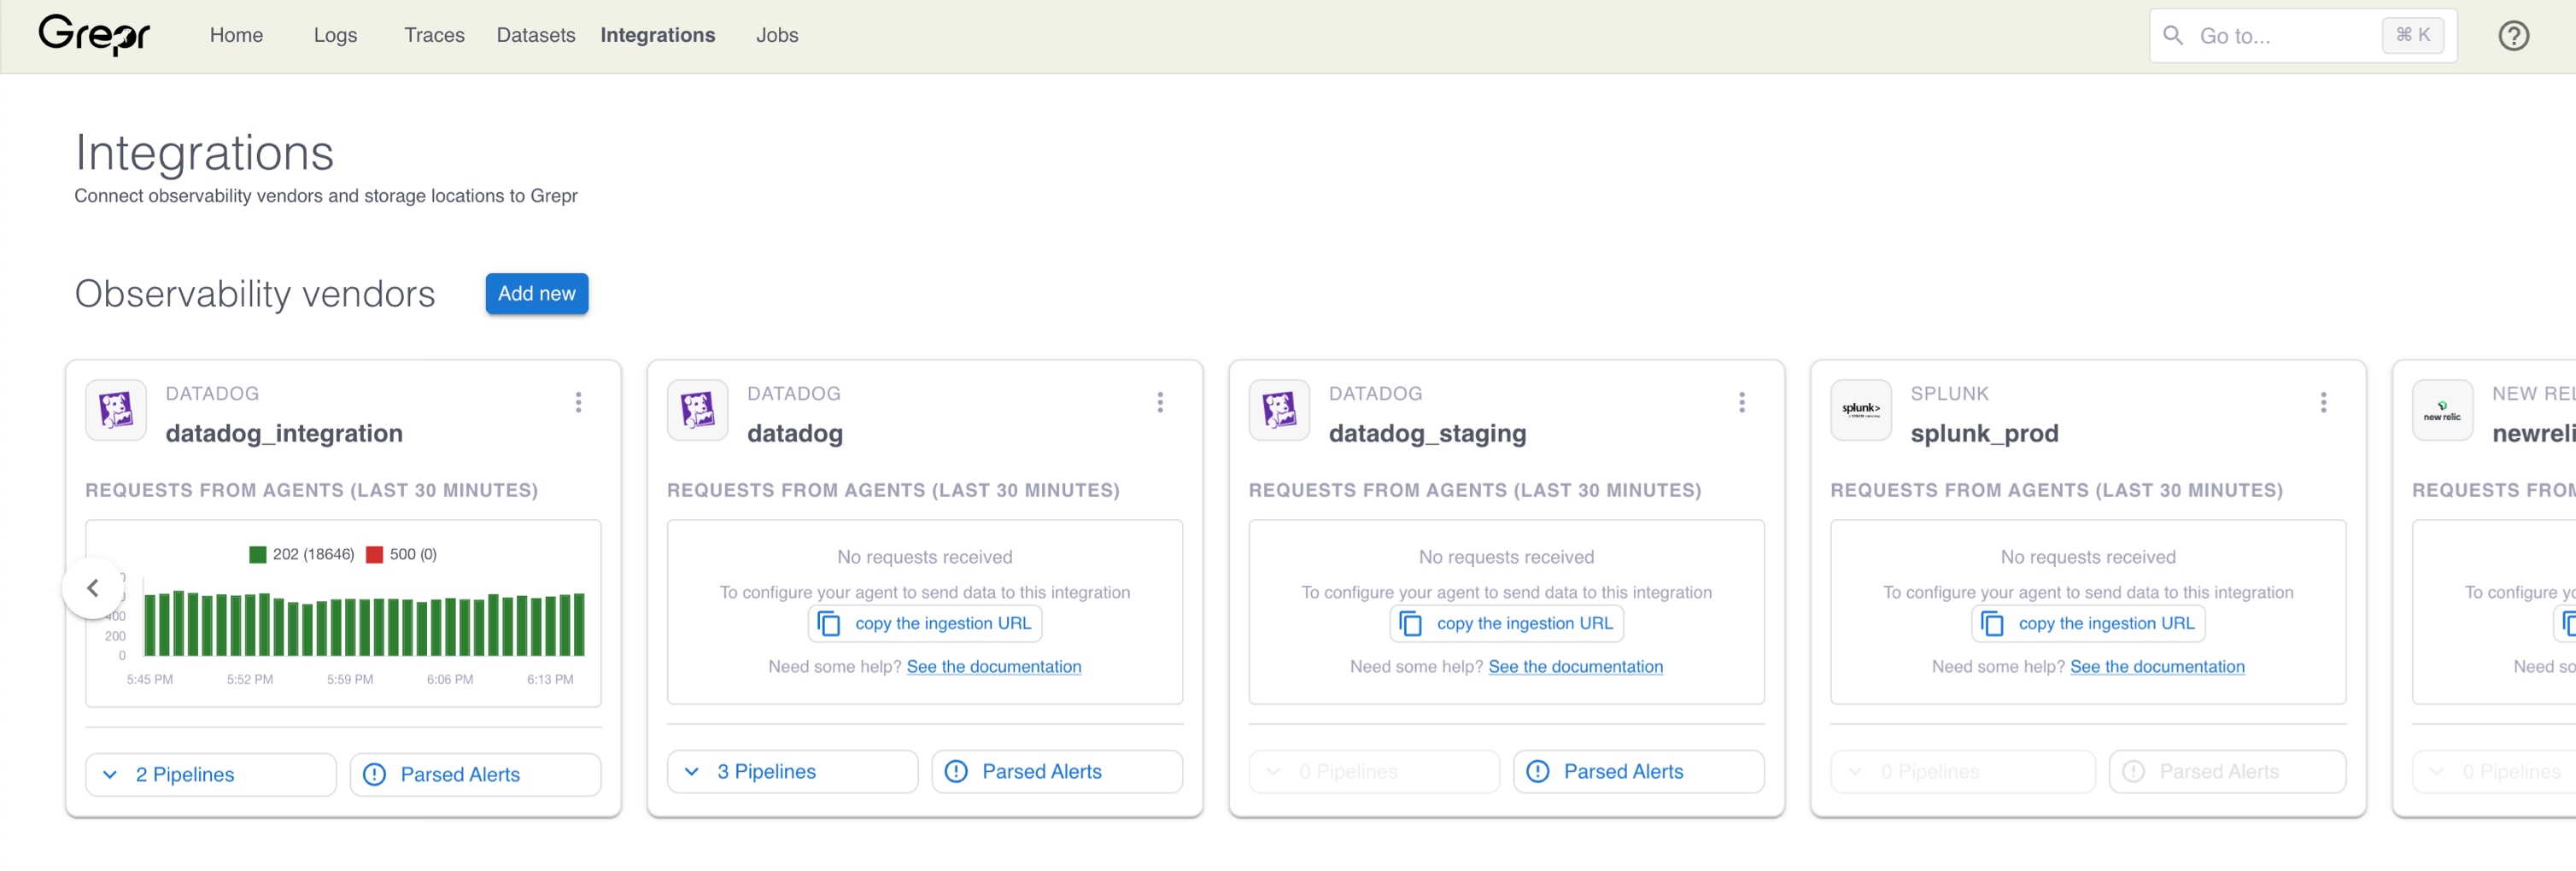
Go to the Integrations page in the Grepr UI and click Add new next to Observability Vendors.
-
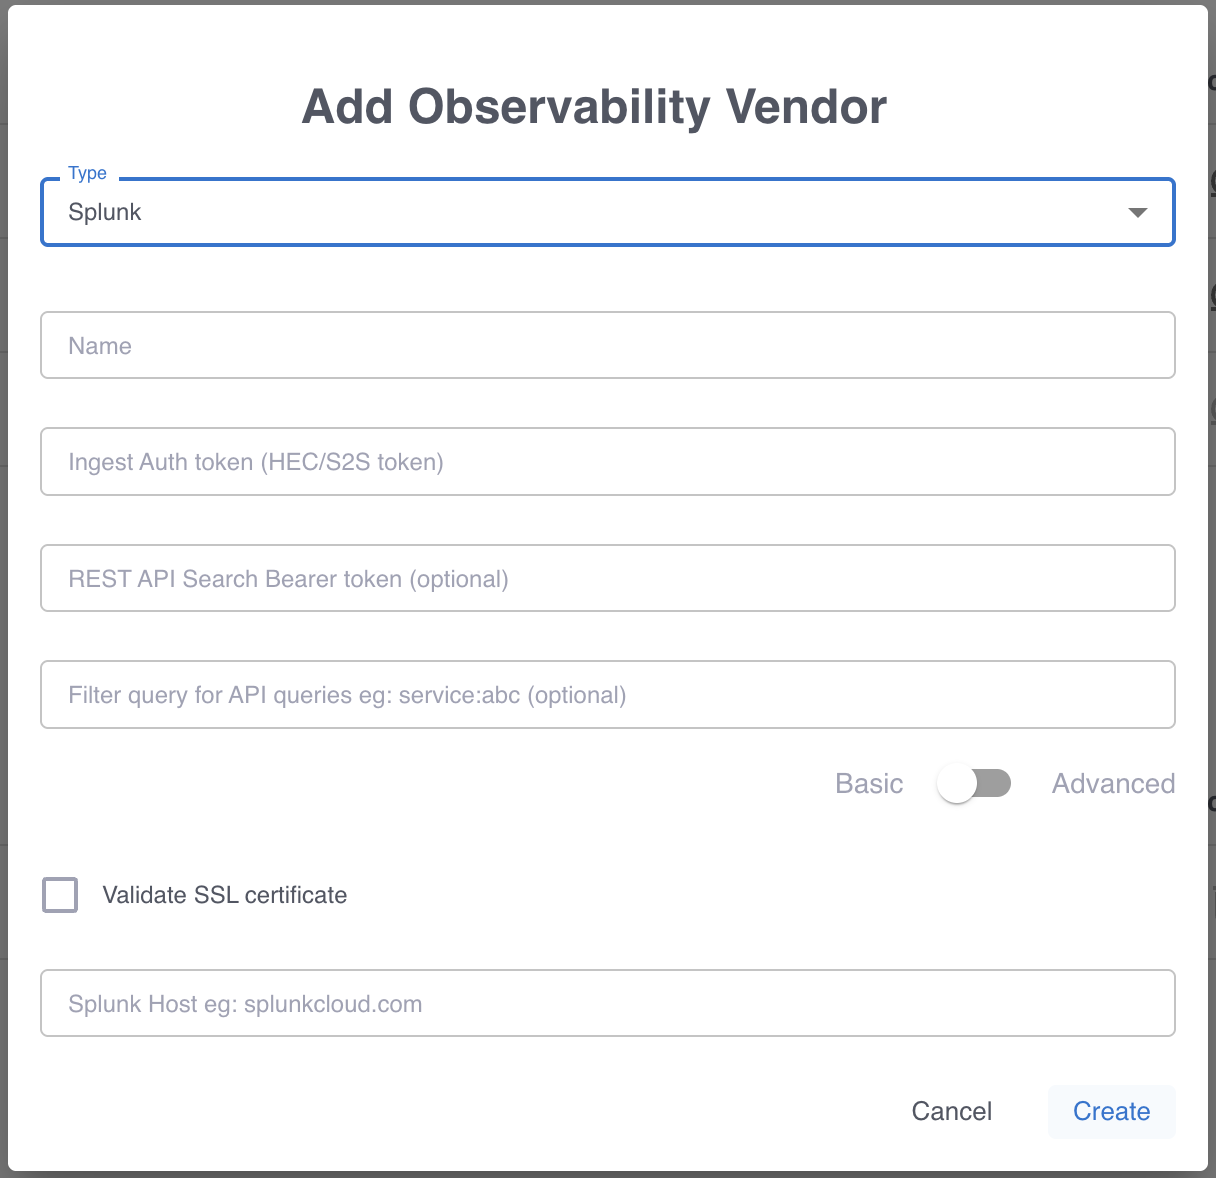
In the Add Observability Vendor dialog:
- In the Type menu, select Splunk .
- In the Name field, enter a name for the integration.
- In the Ingest Auth token field, enter your Splunk HEC token.
- In the Splunk Host field, enter the hostname for your Splunk instance.
- Optional: To use an HTTP source to ingest data, in the REST API Search Bearer token field, enter a Bearer token to authenticate against the Splunk API. The token must be associated with a user with the required permissions. See the Requirements.
- Optional: Use the Validate SSL certificate checkbox to turn validation of SSL certificates on or off when Grepr connects to your Splunk instance.
-
Click Create.
Optional: Grant team access to the integration
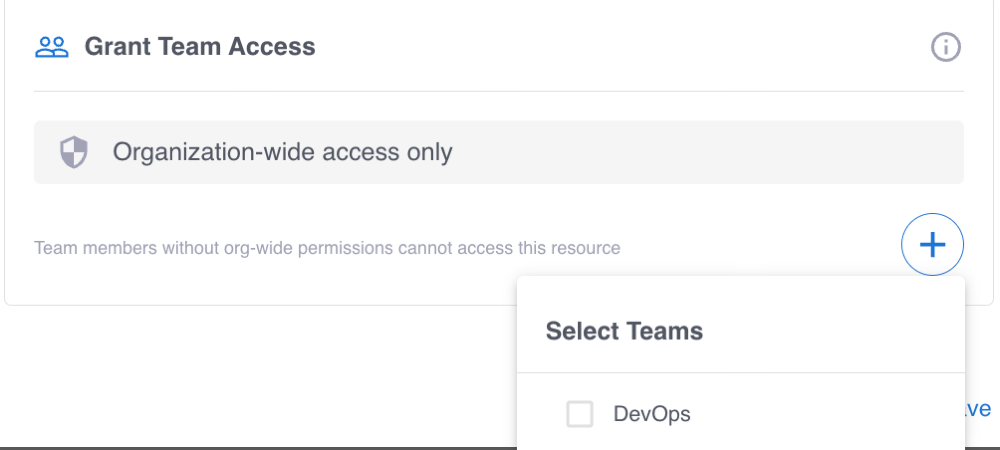
When you have teams in your Grepr organization, you can grant access to the integration to one or more of those teams. To configure team access when you create or edit an integration:
-
In the Grant Team Access section, click the plus sign icon (+).
-
Select the team or teams that should be granted access to the integration.
-
Click Create.
To learn more, see Manage teams in the Grepr platform and Permissions in the Grepr platform.
-
Step 2: Add a source to your pipeline
To add a source to your pipeline that uses the Splunk integration:
- In the Grepr UI, go to the overview page for an existing pipeline or create a new pipeline from the homepage.
- In the left-hand navigation menu on the pipeline overview page, click Sources.
- In the Add source dialog, select the Splunk integration in the Source menu.
- Click Submit.
Step 3: Forward logs to Grepr using HEC
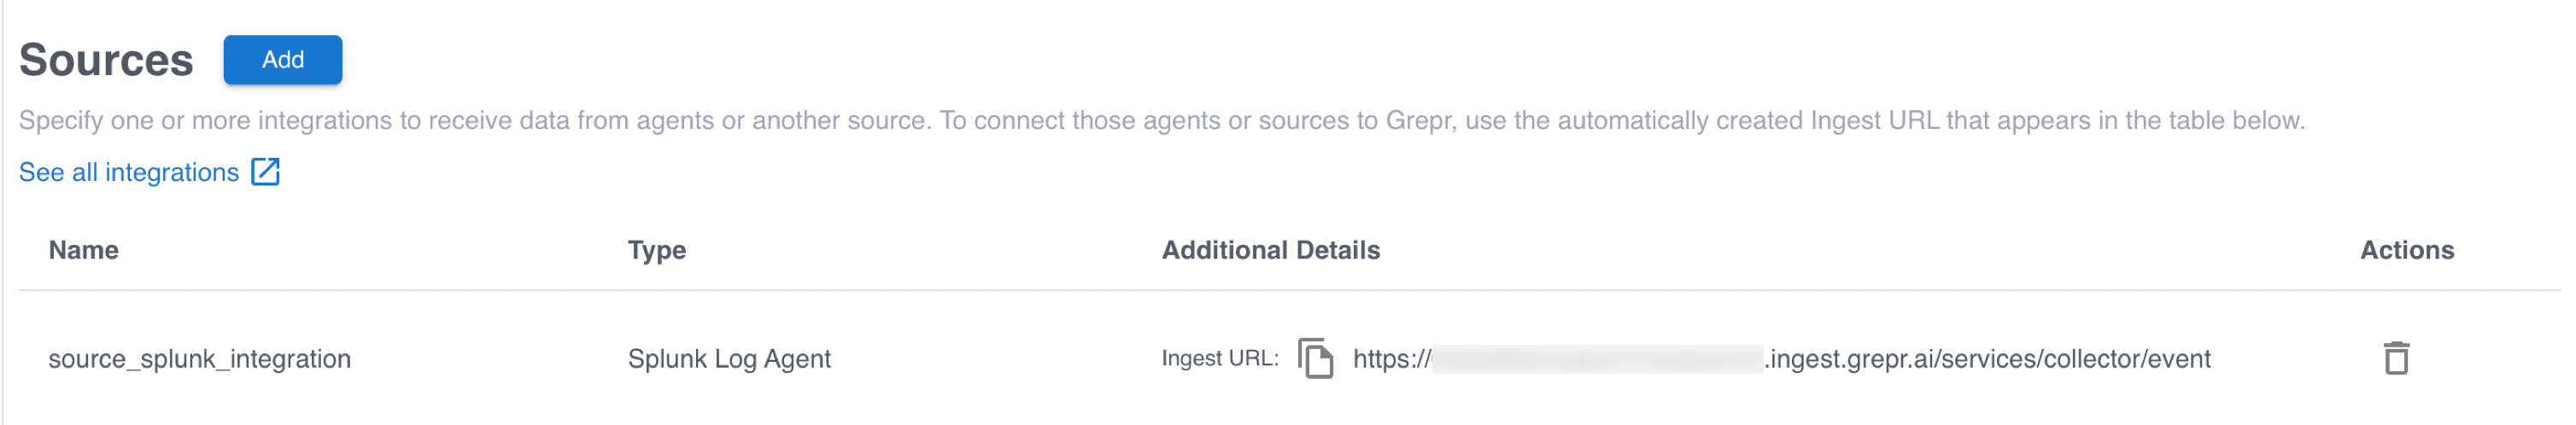
To send data to Grepr, you configure your collector or agent to send it to the ingestion URL for your Grepr integration, rather than to your observability vendor’s platform. To find the ingestion URL when using the Grepr UI to configure your pipeline, go to the details page for the pipeline, click Sources in the left pane, and copy the Ingest URL.
When you use the API, you can construct the ingestion URL using the following format:
https://<integration-id>-<org-id>.ingest.grepr.ai/services/collector/event
Replace <integration-id> with the identifier of the vendor integration used by your pipeline and replace <org-id> with the identifier for your organization.
Although all sources created from the same integration share the same ingestion URL, you can use a single integration to create sources for multiple pipelines. The Grepr platform ensures events are routed to the correct pipelines.
To see more information and configuration examples, select the tab for your preferred collector:
Fluent Bit
Fluent Bit can forward logs using the Splunk output plugin. To configure the plugin, set the Host value to the hostname from the Splunk integration’s ingestion URL and the Splunk_Token value to your Splunk HEC token. The following is an example OUTPUT section from a Fluent Bit configuration file (fluent-bit.conf):
[OUTPUT]
   Name              splunk
   Match             *
   Host              <ingestion-host>
   Port              443
   TLS               On
   TLS.Verify        On
   Splunk_Token      <hec-token>
Replace:
<ingestion-host>with the hostname from your ingestion URL. Do not include thehttps://prefix or the path value. For example, if the ingestion URL ishttps://0abc1defghij2-<org-id>.ingest.grepr.ai/services/collector/event, set the value to0abc1defghij2-<org-id>.ingest.grepr.ai.<hec-token>with your Splunk HEC token.
To learn more about configuration settings for Fluent Bit, see the documentation for the Fluent Bit Splunk output plugin .
Step 4: Add a sink to your pipeline
To add a sink to your pipeline that uses the Splunk integration to send processed logs to your Splunk instance:
-
In the Grepr UI, go to the overview page for your pipeline.
-
In the left-hand navigation menu, click Sinks.
-
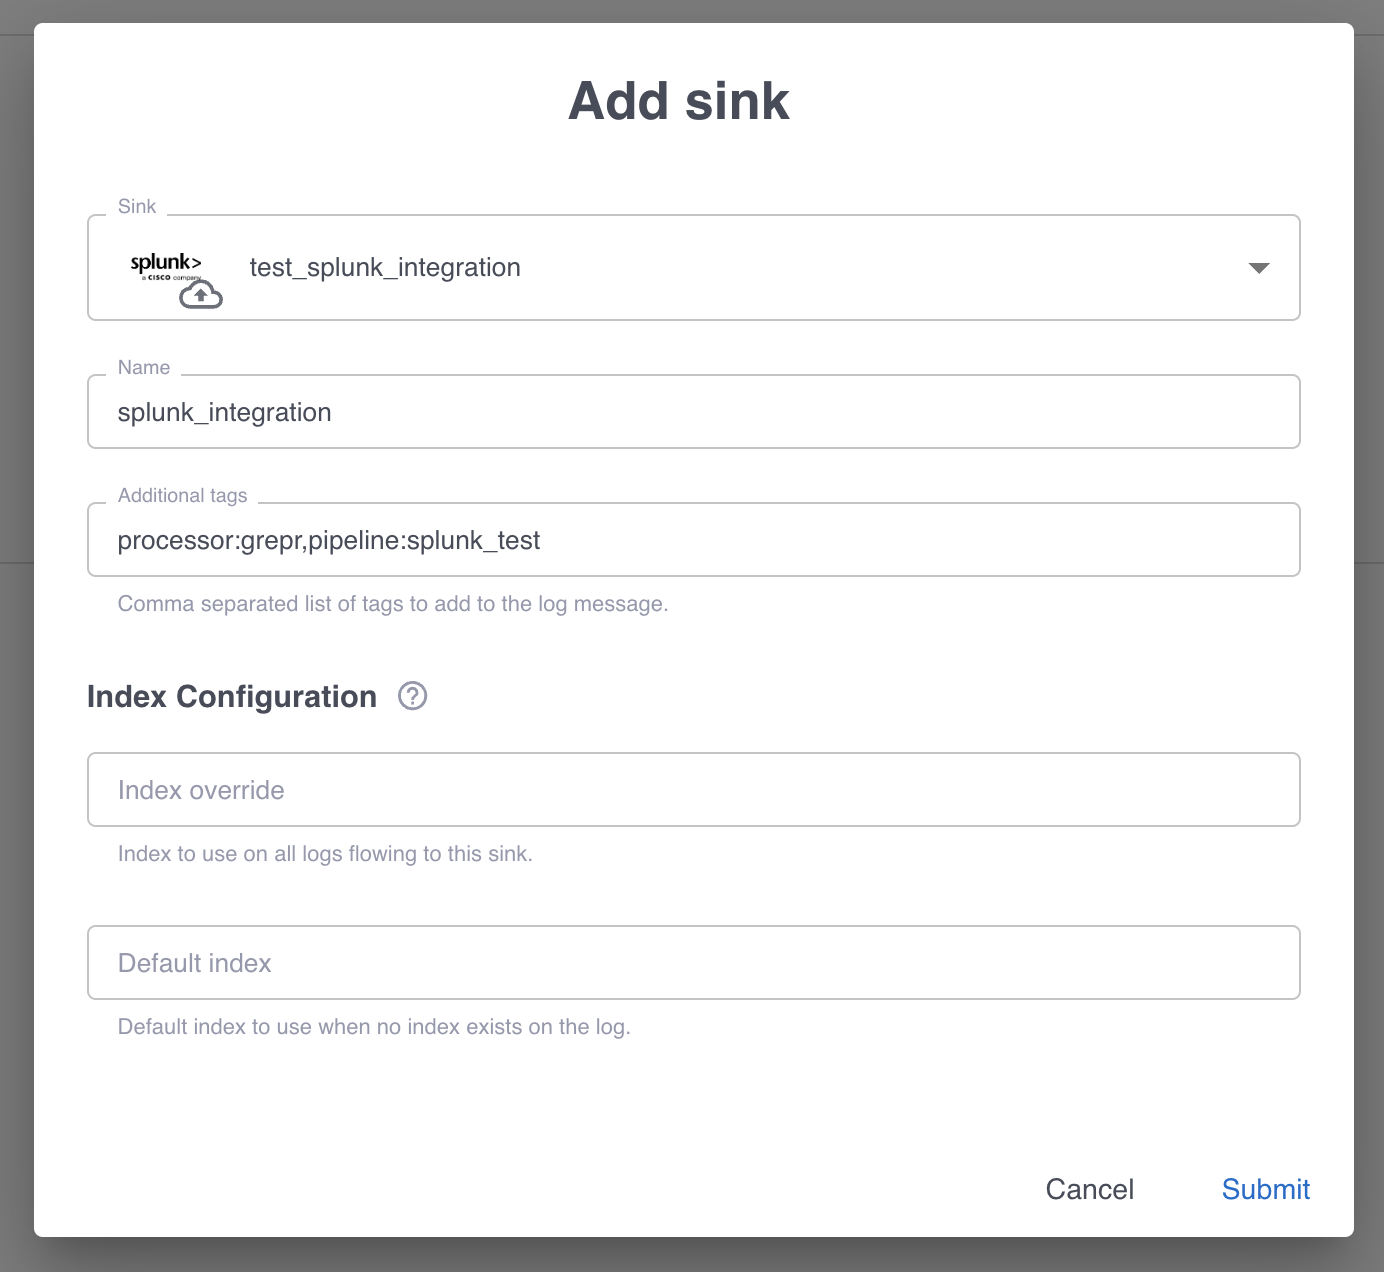
In the Add sink dialog:
- Select the Splunk integration in the Sink menu.
- In the Name field, enter a name for the integration.
- In the Additional tags field, specify comma-separated tags to add to all log messages sent through this sink. You can use these tags to filter and organize logs in Splunk. For example:
processor:grepr,pipeline:my_pipeline,environment:production.
-
The Index Configuration section allows you to configure how logs are routed to Splunk indexes. Grepr follows a specific index routing logic to determine the destination index for each log:
- Index override takes priority: If an Index override value is provided, all logs flowing to this sink will use this index, regardless of any other index information.
- Log-level index field: If no Index override value is provided and an
indexfield exists on the log (from an agent or transformations), that index is used. - Sink default index: If no Index override value is provided, and no
indexfield exists on the log, the Default index field specified in this sink configuration is used. - HEC token default: If none of these conditions are met, the log is routed to the default index configured on the HEC token in your Splunk instance.
-
Click Submit.
Ingest log data from Splunk using the Splunk HTTP source
You can use the Splunk HTTP source to read log data from a Splunk instance into Grepr. You can use this feature for tasks such as moving Splunk logs to another platform or testing Splunk log processing in Grepr without modifying forwarders.
To configure and use a Splunk HTTP source in a pipeline:
- Create a Splunk integration that includes an authorization token for the Splunk REST API. See Step 1: Create a Splunk integration.
- In your pipeline, add a server source that uses the Splunk integration. See Step 2: Add a source to your pipeline.
Limitations
- The Splunk integration supports only Splunk HEC and S2S over HTTP. TCP connections, including S2S over TCP, are not supported.