Capture and explore agent sessions
An agent session is one complete run of a coding agent: the prompts you sent, the model calls the agent made, the tools it ran, the results those tools returned, and the tokens and cost it consumed. An agent sessions pipeline ingests the telemetry your agent already produces, reconstructs each session from it, and stores the result in a Grepr data lake so you can read the transcript, measure what the agent spent, and find the runs that failed.
Coding agents report this activity as OpenTelemetry data, split across two signals. They describe what happened in the conversation as OTLP log events, and they describe how the run executed as OTLP spans. Neither signal is a session on its own, and neither is readable as a conversation without reassembly. An agent sessions pipeline reads both from the same integration and joins them into a session you can explore.
Agent sessions are enabled for each organization individually. To turn on agent sessions for your organization, contact support@grepr.ai.
What Grepr captures from an agent session
From a supported agent harness, a session records:
- The prompts you sent and the text the agent replied with.
- Every tool call, with its arguments and the result the tool returned.
- Token counts for each model call, broken down into input, output, cache reads, and cache writes.
- The cost the harness reported for the run, when the harness reports one.
- The model and provider that served each call.
- Every error the agent encountered, joined back to the tool call that produced it.
- The identity that ran the session and the duration of each step.
How completely a session is captured depends on the harness and on how you configure it. A harness reports content only when you turn content logging on, and some harnesses do not report every field. Grepr labels these gaps rather than hiding them: a session names the content its harness never sent, and marks content the harness shortened as a truncated capture.
Anatomy of an agent session
Grepr presents every harness the same way, so a transcript reads alike whichever agent produced it.
An emitter is the harness that produced a session, such as claude-code. It appears in the Emitter column of the sessions list, and it is how you tell one harness’s sessions from another’s when several report to the same dataset.
A session is a sequence of turns, where each turn is one prompt and everything the agent did in response. A turn contains events, and the kinds that make up a transcript are:
| Event kind | What it records |
|---|---|
user_message | A prompt you sent to the agent. |
model_call | One request to a model, with its token counts and cost. |
assistant_message | Text the agent replied with. |
tool_call | A tool the agent invoked, with its arguments. |
tool_result | What a tool returned, and whether it failed. |
A session records other kinds too, such as tool decisions and lifecycle events. Every event Grepr stored for a session, whatever its kind, is listed under Raw events in the session.
Alongside the events, a session carries execution spans, which are the timing records for its model calls and tool executions. Events tell you what the agent did; spans tell you how long each step took and how the steps overlapped.
Supported agent harnesses
Grepr recognizes the following harnesses and reports each one as the listed emitter. Grepr identifies a harness by the service name in its telemetry, so do not override OTEL_SERVICE_NAME. A session whose service name has been changed is not recognized, and its data reaches the data lake without being assembled into a session.
| Harness | Emitter | Service name | Setup |
|---|---|---|---|
| Claude Code | claude-code | claude-code | Configure Claude Code |
| Codex | codex | codex_exec or codex_cli_rs | Configure Codex |
| OpenCode | opencode | opencode | Configure OpenCode |
Any harness that exports OTLP logs and traces can send data to an agent sessions pipeline, and that data is stored in your data lake. Grepr assembles sessions only for the harnesses listed here, so telemetry from another harness is searchable but does not appear in the Agent Sessions page.
Create an agent sessions pipeline
An agent sessions pipeline reads a harness’s two signals from a single OpenTelemetry integration. You attach the integration once, and the pipeline reads agent events from its OTLP logs endpoint and execution spans from its OTLP traces endpoint.
Step 1: Create an OpenTelemetry integration
Create an OpenTelemetry integration to receive your agent’s telemetry. Agent sessions require no special integration settings, so follow the instructions for creating an OpenTelemetry integration. Copy the Grepr token when the Grepr Token dialog appears, because you need it to build the ingestion URL in Step 6.
To keep one agent’s sessions separate from another’s, create one integration for each agent you want to report separately.
Step 2: Create the pipeline
To create the pipeline, on the Pipelines page, click Create pipeline, select Agent Sessions Pipeline as the pipeline type, enter a name, and click Create.
Step 3: Add sources
A source is one OpenTelemetry integration carrying one agent’s events and execution spans. To add a source, on the pipeline details page, click Sources in the left pane, then click Add source. In the Add Source dialog:
- In the OTLP Integration menu, select the integration you created in Step 1.
- In the Source Name field, enter a name using lowercase letters, numbers, and underscores. Grepr suggests a name based on the integration you selected.
Click Add to save the source. Grepr derives both signals from this one source, so you do not add a separate source for logs and traces.
You cannot change the integration on an existing source. To point a source at a different integration, delete the source and add a new one.
Step 4: Store sessions in the data lake
To choose where Grepr stores your sessions, click Data Lake in the left pane, then click Add. In the Configure Data Lake dialog, select a dataset from the Dataset menu and click Add. To move the pipeline to a different dataset later, click Edit. Grepr stores the events and execution spans for every session in this dataset, which is what makes sessions searchable in the Agent Sessions page. To learn more about how Grepr stores your data, see The Grepr data lake.
Step 5: Optionally forward sessions
To send sessions to another platform, click Sinks in the left pane and add an OpenTelemetry integration. Grepr forwards a session’s events to the integration’s OTLP logs endpoint and its execution spans to the traces endpoint, so the destination must accept both. A pipeline that only stores sessions in the data lake needs no sinks.
Step 6: Configure your agent to send telemetry
Configure your agent to export OTLP to the ingestion URL for the integration you added as a source. For the settings each supported harness requires, select the tab for your agent in the configuration examples for sending data to Grepr.
How many signals a harness needs depends on the harness. Claude Code and Codex report part of a session on their log events and part on their spans, so configuring either for a single signal produces an incomplete session. OpenCode reports a whole session on its spans, so it needs traces alone.
Explore agent sessions
To read the sessions your pipeline captured, in the Agent Sessions menu, select the dataset you configured in Step 4. Set a time range and run a search to list the sessions active in that range.
The sessions list reports one row per session, with the time it started, the earliest prompt in the range, the emitter, the identity that ran it, the model, the number of tool calls, the duration, and the number of errors. Because the widest column is the earliest prompt, you can scan the list for the session you want by what it was asked to do. To narrow the list, enter a query in the search field. A session matches when any of its content matches, and the Matched content column shows which part matched.
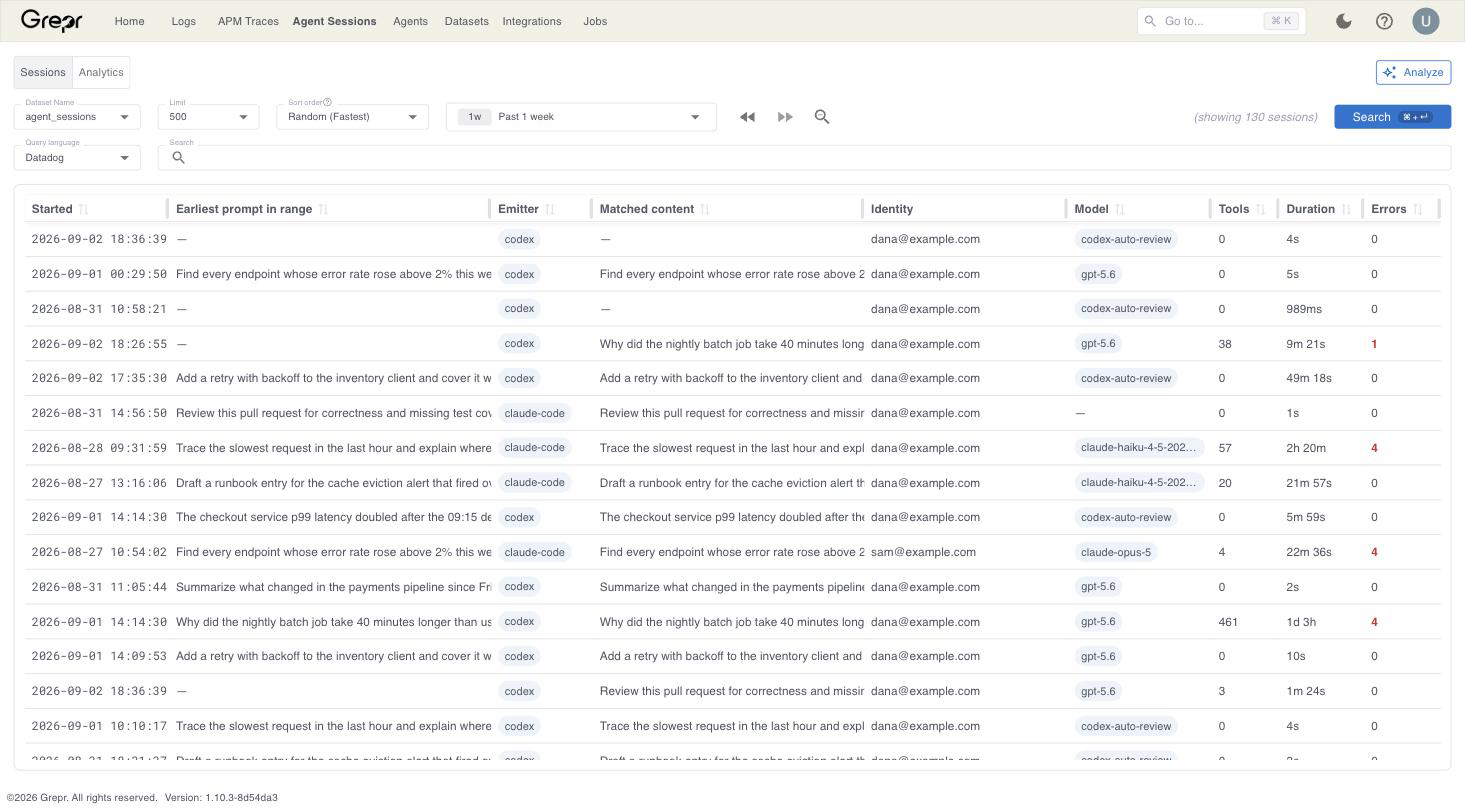
Filter the sessions list
The search field takes the same Datadog-like syntax as Log Explorer, so a bare word searches the content of a session. To learn more about the syntax, see Search logs using a Datadog-like syntax.
Grepr also tags every event it stores for a session, and you can filter on those tags:
| Tag | What it holds |
|---|---|
agent_emitter | The harness that produced the session, such as claude-code. |
agent_session_id | The session’s identifier, which is the value shown in the session header. |
agent_event_kind | The kind of event, such as tool_call. |
agent_turn_id | The turn the event belongs to. |
For example:
agent_emitter:claude-code

agent_emitter:codex agent_event_kind:tool_call

agent_session_id:8c1d4a02-5e7b-4f19-9a30-b6e2c4d80f55
The kinds a session records go beyond the five that make up a transcript, and which kind carries a
given fact depends on the harness. A tool result Grepr captured only as metadata is stored as
tool_result_metadata rather than tool_result, which is what a Claude Code session captured
without spans records. To see the kinds a session actually stored, open it and read Raw events.
Grepr searches a session’s events rather than the session as a whole, so a session matches when any one of its events matches. Filtering on a kind therefore selects the sessions that recorded that kind of event, and each matching session still opens on its full transcript. Combining terms narrows the list, because Grepr applies them together.
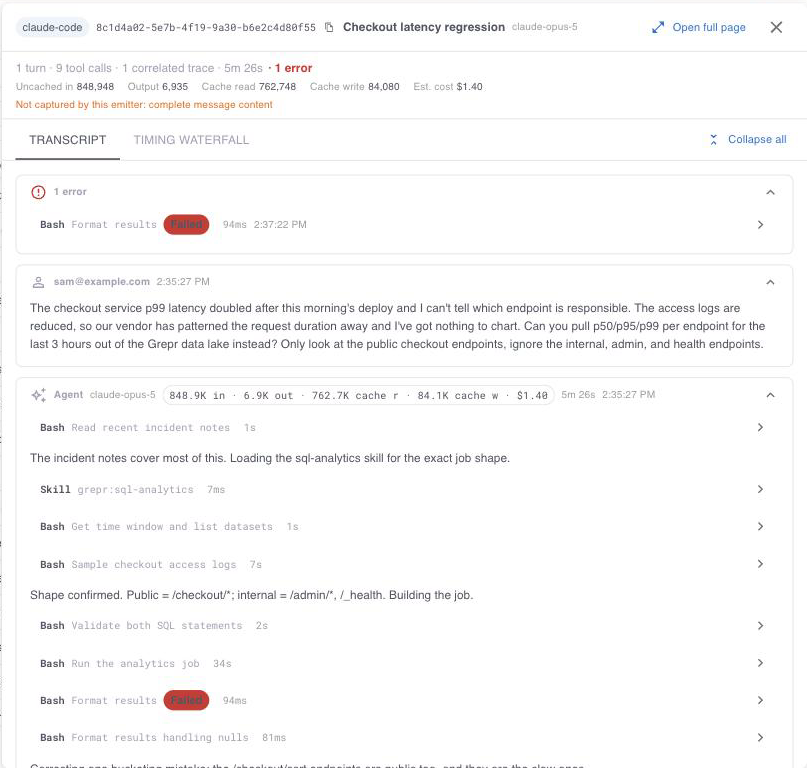
Select a session to open it. A session opens on the following views:
- The Transcript view reads the session as a conversation, one card per turn, with each model call, tool call, and tool result nested under the turn that produced it. Use Collapse all to scan a long session by turn, and expand a turn to read its content.
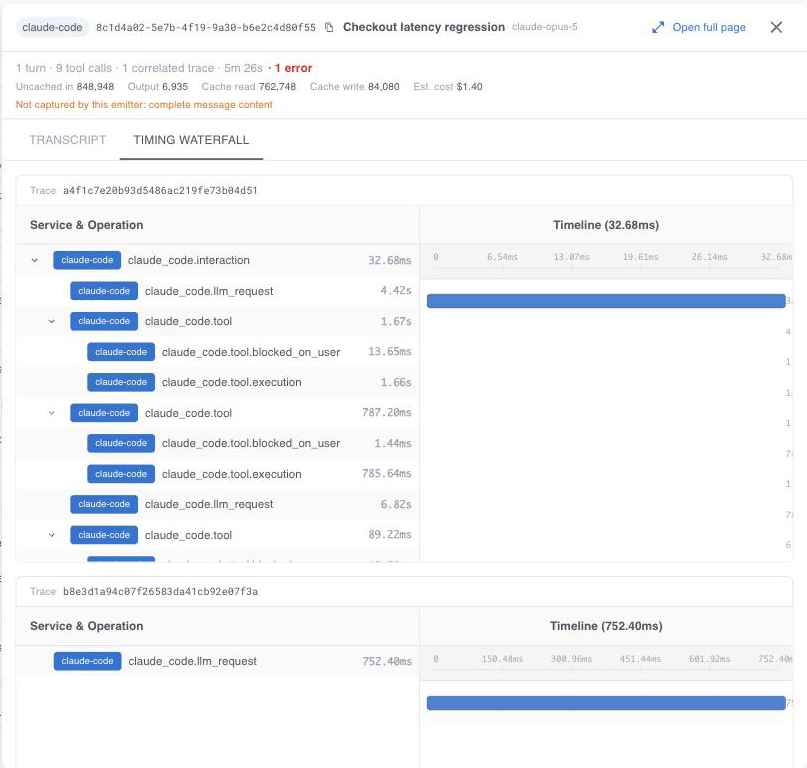
- The Timing waterfall view charts the session’s execution spans, so you can see how long each model call and tool execution took and which steps overlapped. This view appears only when the session has execution spans.
Above the transcript, a summary bar reports the session’s shape and what it consumed: turns, tool calls, errors, duration, token counts, and cost. Every error in the session is listed above the transcript as well, each one joined back to its tool call, so you do not have to search a long transcript to find what failed. Raw events lists every event Grepr stored for the session, which is where you confirm what a harness actually sent when a transcript looks incomplete.
The timing waterfall charts the same session as a span tree, so a step that dominated the run is visible without reading the transcript.
Analyze many sessions at once
Reading one session tells you what one run did. To find the patterns across many runs, run an analysis over a set of sessions. An analysis reads the sessions your search selected, groups them by what you asked the agent to do, labels each group, and reports what each group consumed.
Grepr groups sessions by meaning rather than by matching text, so two sessions that asked for the same thing in different words land in the same group. A session that fits no group is counted as miscellaneous rather than forced into one it does not belong to.
Start an analysis
To start an analysis, on the Agent Sessions page, run the search that selects the sessions you want, then click Analyze. In the Analyze agent sessions dialog:
- In the Session cap field, set the maximum number of sessions to analyze. The default is
10000and the maximum is100000. - In the Maximum named groups field, set how many groups the analysis labels. The default is
20and the maximum is100. - In the Model integration menu, select the OpenAI or Gemini integration that Grepr uses to group and label the sessions.
An analysis covers a time range of at most 31 days, and it analyzes the sessions from the search you last submitted. Because an analysis calls the model integration you select, it consumes tokens on that integration.
Grepr runs the analysis in the background. To read the reports it produces, click Analytics.
Read a report
The Analytics view lists one row per report, with the report identifier, when it was created, the query and time range it covers, its status, and how many sessions it analyzed and groups it found. Expand a row to see how the analysis ran: the session cap and group limit it used, how many sessions matched and were analyzed, how many groups were named against how many sessions were left as miscellaneous, the embedding and labeling models, and any warnings.
To open the visualizations for a report, in the row’s actions menu, click Visualize.
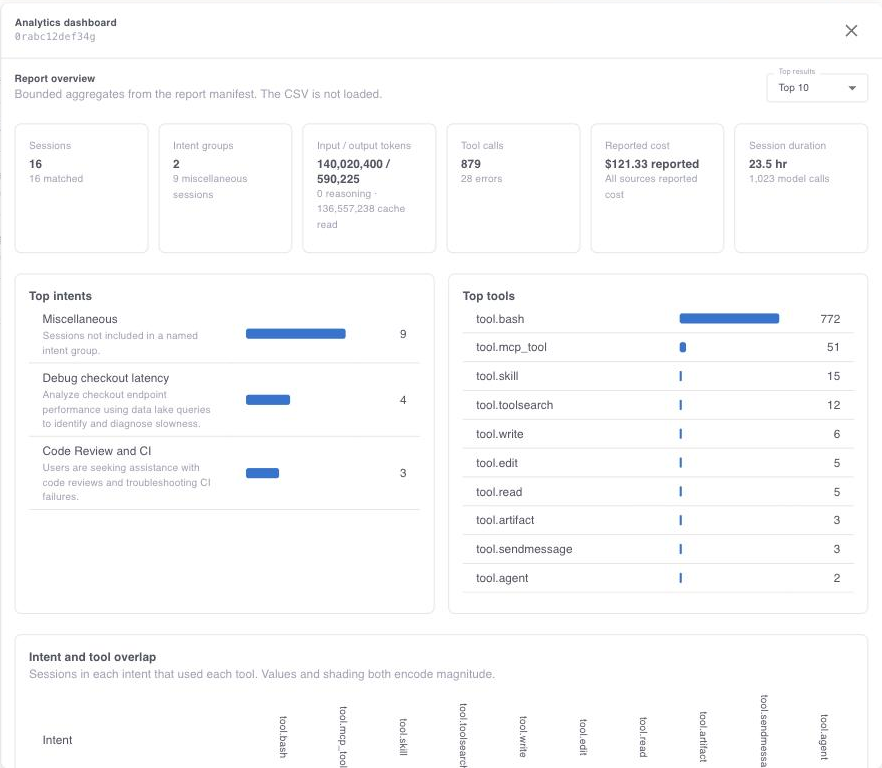
A dashboard opens on a row of totals for the sessions it analyzed: how many sessions and intent groups it found, input and output tokens with reasoning and cache reads broken out, tool calls and how many of them failed, the cost the harnesses reported, and the total session duration with the number of model calls behind it. Below the totals, two charts rank the intents by number of sessions and the tools by number of calls, so you can see what your agents are most often asked to do and which tools carry that work. Each intent carries the description the labeling model wrote for it. Use the Top results menu to change how many rows each chart shows.
Compare intents against tools and models
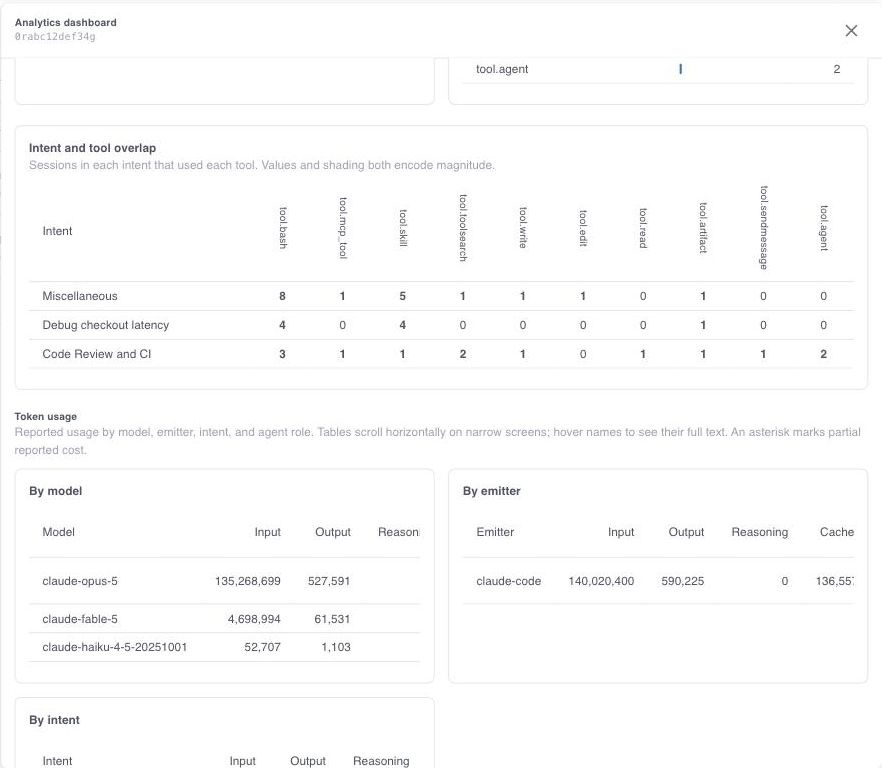
The Intent and tool overlap table reports how many sessions in each intent used each tool, shading each cell by magnitude, which is where a tool that only one kind of work depends on becomes visible.
The Token usage tables break the same reported usage down by model, by emitter, by intent, and by agent role, so you can attribute spend to the work that caused it rather than to the harness as a whole. An asterisk marks a total whose reported cost is only partial, because not every harness reports cost.
The dashboard charts summaries that Grepr computes when the analysis runs, not the sessions themselves. To work with the sessions individually, in the row’s actions menu, click Download report and analyze the CSV.
Troubleshoot agent session capture
An agent that is exporting telemetry successfully can still produce no sessions, because the data reaching Grepr is the wrong shape rather than absent. Check the following before investigating the pipeline.
Sessions appear but have no timing waterfall. The harness is exporting log events but not spans. Claude Code exports spans only when you set CLAUDE_CODE_ENHANCED_TELEMETRY_BETA=1 alongside a traces exporter. Codex uses a separate otel.trace_exporter setting for spans, and configuring only otel.exporter sends log events alone. In both cases the agent reports no error, because each harness is doing exactly what you configured.
A transcript shows metadata but no prompts, responses, or tool results. Content logging is off. Claude Code and Codex redact content by default, so you must turn it on explicitly. For the settings each one uses, see the tab for your agent in the configuration examples for sending data to Grepr. OpenCode’s plugin reports content without a separate setting, so an OpenCode session missing content points at the plugin instead.
Data arrives in the data lake but no sessions appear. Grepr received telemetry it does not recognize as agent activity. The most common causes are an overridden OTEL_SERVICE_NAME, which stops Grepr identifying the harness, and, for OpenCode, a missing OpenTelemetry plugin. Without the plugin, OpenCode’s built-in instrumentation reports internal runtime operations such as sql.execute instead of agent activity, and that data is stored without being assembled into a session.
A session names content its harness never sent. This is expected for some harnesses and is not a configuration error. Codex reports no assistant text at all, so its sessions show the note that the emitter does not report assistant responses. Claude Code reports tool output only on a span event, so a session captured without spans records the size of each tool result rather than its content.