Aggregate logs with Analyze mode
Log Explorer’s Analyze mode groups and aggregates the logs your search returns instead of listing them. You describe the analysis as a set of Grepr SQL expressions, and Grepr runs it against the logs in the data lake.
Create an analysis
- Go to Log Explorer and select a dataset and a time range.
- Enter a search query to filter the logs you want to analyze. Analyze mode accepts the same Datadog-like syntax and New Relic log query-like syntax as searching.
- Open the Analyze… drawer under the search controls.
- Under SELECT, enter one expression per result column, and name it in the Alias field beside it. An alias is optional; a column you leave unnamed is named for you, after the field or function it computes.
- Under GROUP BY, add the expressions whose distinct combinations you want as rows. Each grouping expression also becomes a result column, so the rows show the values they are grouped on. Without a grouping expression, an analysis made only of aggregates returns a single row.
- Under HAVING, enter a condition over the aggregates to keep only some of the groups. Leave it empty to keep every group.
- Under ORDER BY, add the expressions to sort by and pick ascending or descending for each one.
- Set Row limit, the maximum number of rows to return. An analysis returns 2,500 rows by default, up to the largest limit your deployment allows.
- Set Scan budget to cap how much of the lake the query may read, then run the analysis.
The drawer’s clauses are the SQL ones, so an analysis reads the way the query does: SELECT computes, GROUP BY collapses, HAVING filters the groups, ORDER BY and the row limit choose which of them you see. GROUP BY, HAVING and ORDER BY can refer to a result by its alias.
Every SELECT column is either an aggregate or one of the grouping expressions. To count events by a field, add the field under SELECT and group by it.
Log fields
Expressions address the stored log columns by the following names:
| Field | Type | Description |
|---|---|---|
message | VARCHAR | The log line. |
severity | INTEGER | The numeric severity level, where a higher number is more severe. |
event_timestamp | TIMESTAMP | When the event happened. |
received_timestamp | TIMESTAMP | When Grepr received the event. |
id | VARCHAR | The identifier of the event. |
tags | MAP | The tag values, keyed by tag name. |
attributes | VARIANT | The whole parsed attribute document. |
These are the Grepr SQL column names, which use snake_case. They are not the camelCase field names of the log event JSON that the search and export APIs return.
A tag holds an array of values, so picking a tag key from the suggestions groups by the sorted, comma-joined set of its values — two events tagged with the same values in a different order land in one group:
ARRAY_TO_STRING(SORT_ARRAY(tags['service']), ',')Index a single value with [1] when you want only the first:
tags['service'][1]Attribute values
Grepr parses structured logs into an attribute document. Address a single attribute with the @
form, which takes a dotted path through that document:
@duration_ms
@http.status_code
@kubernetes.labels.app
The shorthand reads one value out of the parsed document. The attributes column is the whole
document, so use @ when you want a field and attributes when you want the object itself.
An attribute name is a dotted path of letters, digits, and underscores. A hyphen or a slash can
join characters inside a segment, so @trace-id and @app.kubernetes.io/name are each one name.
Because - and / are name characters, put whitespace around them when you mean subtraction or
division: write @bytes / 1024, not @bytes/1024 (which reads bytes/1024 as one name). Every
other character ends the name, so @status=500 and @duration_ms*2 work without spaces.
To read a key that uses any other character, such as a space, comma, or bracket, reference it
through the attributes column with a single-quoted key in brackets. The bracketed key can be any
string, dots included, and names exactly one key; double a single quote to include one. Add one
bracketed key per level of a nested path:
attributes['service.status']
attributes['special outer key']['special inner key']
An attribute has no declared type, because two logs in the same dataset can carry different types
under the same name. Grepr infers a type from how you use the value, so SUM(@duration_ms) reads it
as a number and LOWER(@user.email) reads it as a string.
Cast the attribute when you need a specific type or precision, and when you sort:
-- Read the attribute as a whole number
CAST(@duration_ms AS BIGINT)

-- Or aggregate the cast value
MIN(CAST(@duration_ms AS DOUBLE))
Grepr reads a numeric attribute as a 64-bit floating point value, which represents whole numbers
exactly only up to 9,007,199,254,740,992. Above that limit, two different whole numbers can compare
as equal. Store large identifiers such as trace ids and 64-bit request ids as strings, which always
match exactly. If an attribute already holds a large whole number, cast it to BIGINT to compare it
exactly.
Sorting by an attribute you have not cast sorts it as text, so 100 sorts before 99. Cast it to
sort numerically.
A path segment is a name or a number, and the segments are separated by dots.
Expressions
Expressions are Grepr SQL, so aggregates, CASE, CAST and scalar functions are all available.
Every function an analysis can call is listed in the Analyze function reference, with its arguments and a worked example. Focus an expression box or start typing to find fields, functions, sampled tag and attribute keys, and result aliases.
The SQL transform function reference does not describe Analyze. A SQL transform runs inside a pipeline on Flink SQL; an analysis runs on the query engine over the data lake. The two support different functions, so a function listed there may not exist here, and the autocomplete offers functions that page does not list.
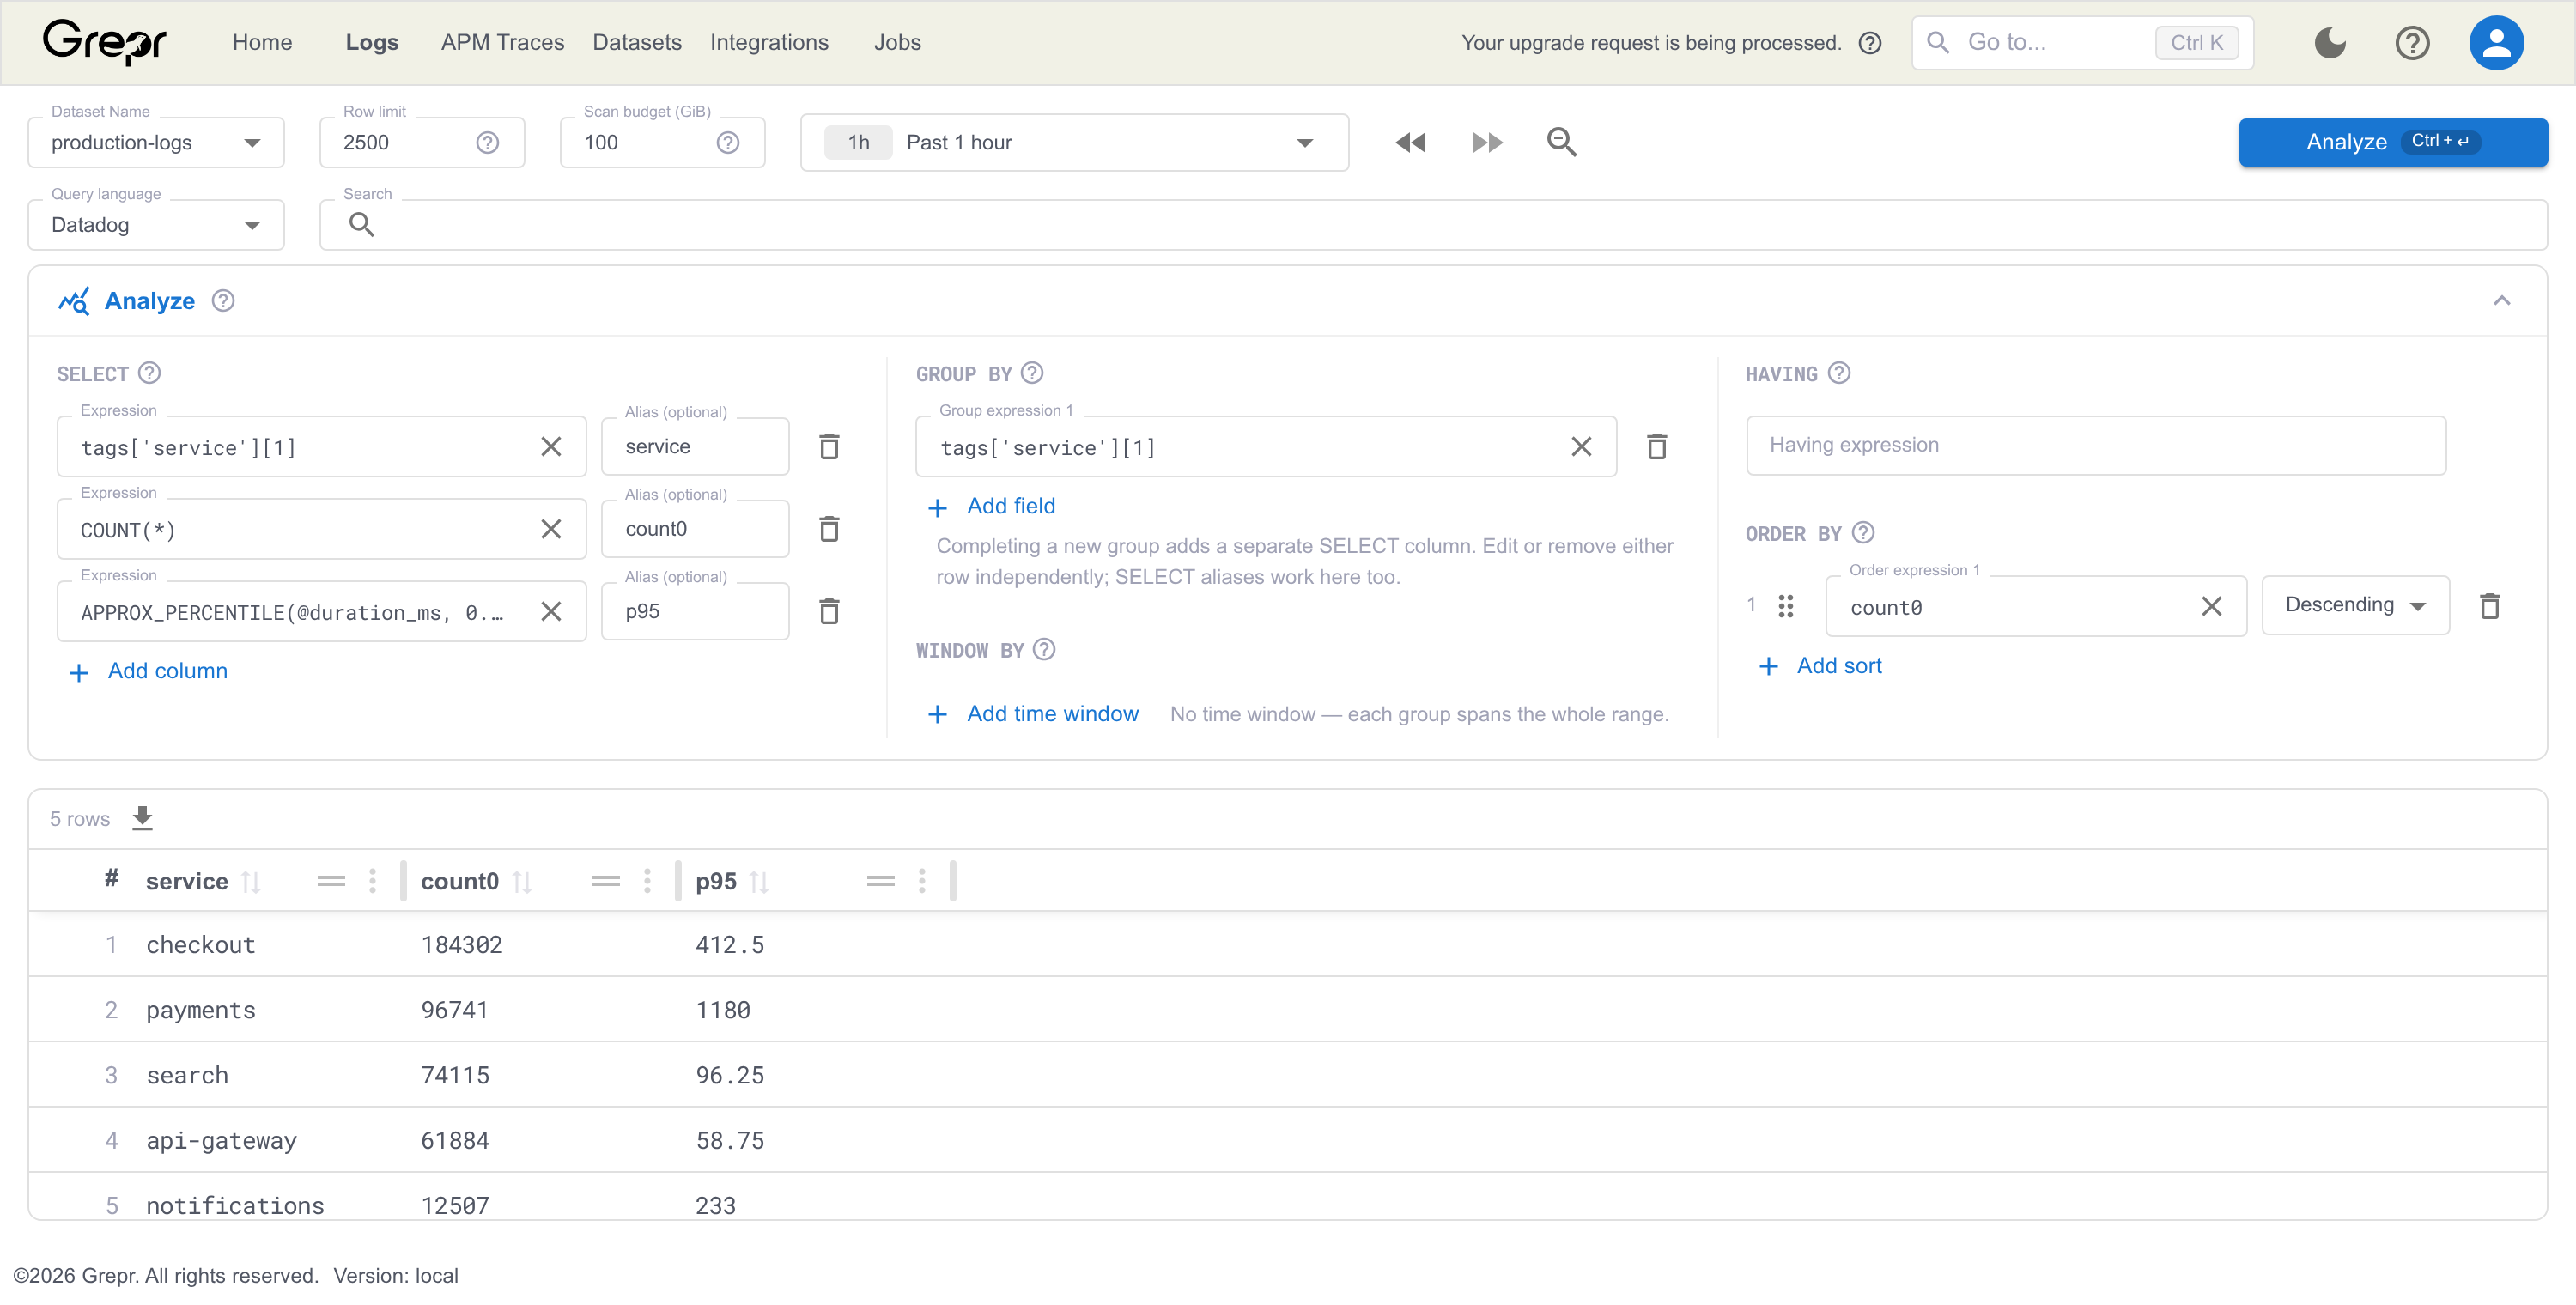
-- Log count by service: the first line goes under SELECT, the second under GROUP BY
COUNT(*)
ARRAY_TO_STRING(SORT_ARRAY(tags['service']), ',')

-- 95th percentile request duration by endpoint, the same way
APPROX_PERCENTILE(@duration_ms, 0.95)
@http.route

-- A SELECT column that buckets rather than aggregates
CASE WHEN severity >= 4 THEN 'error' ELSE 'ok' END
SEVERITY_TEXT names the OpenTelemetry severity bucket a severity number falls in: TRACE,
DEBUG, INFO, WARN, ERROR or FATAL, and nothing for a log with no severity. It takes a whole
number, so cast an attribute before passing it. Grouping by it is the usual way to count logs per
level:
-- Under SELECT
COUNT(*)

-- Under GROUP BY
SEVERITY_TEXT(severity)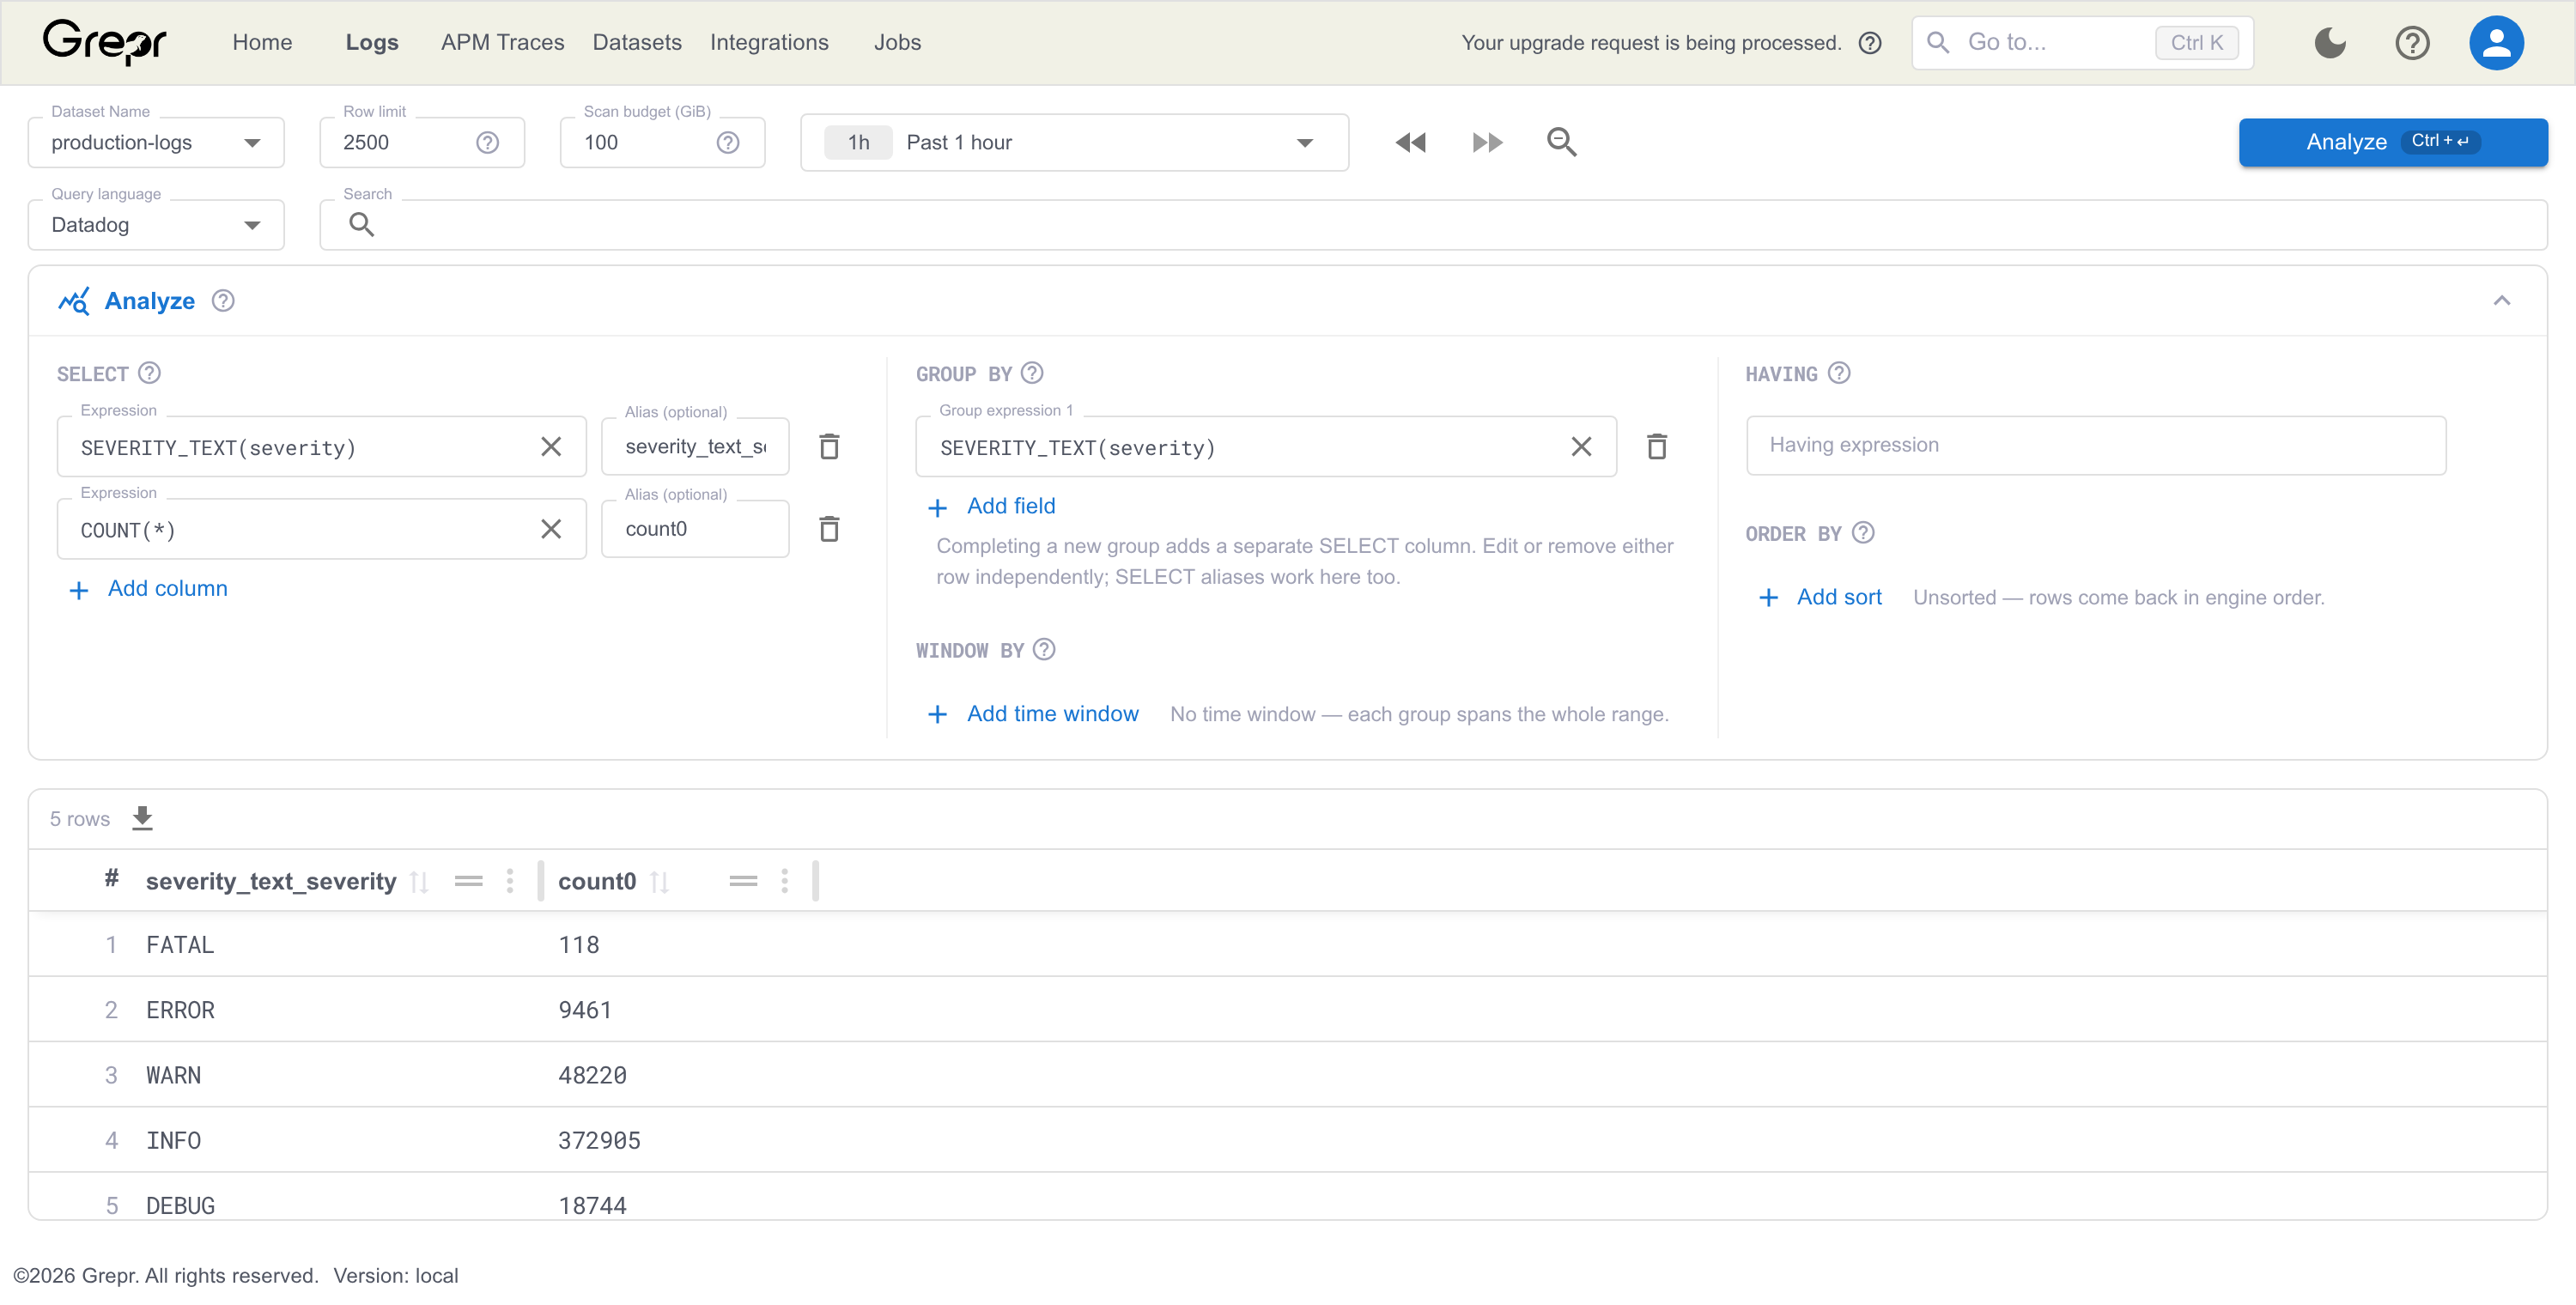
Name the results
Every SELECT column takes an optional alias, entered in the Alias field beside the expression. The alias becomes the result column’s name. Leave it empty and Grepr names the column after the expression itself:
| Expression | Alias | Result column |
|---|---|---|
COUNT(*) | empty | count0 |
APPROX_PERCENTILE(@duration_ms, 0.95) | p95 | p95 |
ARRAY_TO_STRING(SORT_ARRAY(tags['service']), ',') | service, filled in for you | service |
severity | empty | severity |
@http.route | route | route |
An alias can then be referred to under GROUP BY, HAVING or ORDER BY, anywhere inside that expression rather than only as the whole of it:
-- Under HAVING
count0 > 100

-- Under ORDER BY
p95 / 1000
Aliases are lowercase, made of letters, digits and underscores, up to 128 characters, and a reference has to match exactly.
Enter the alias in its own field, not in the expression: AS p95 inside an expression is not
valid. An alias is available to GROUP BY, HAVING and ORDER BY, and to the SELECT columns after the
one that defines it.
Reserved SQL words cannot be aliases, because the query engine would read them as syntax. That is
why the default first column is count0 rather than count, and why a name Grepr derives for you
gains a 0 when it lands on a reserved word.
count, max, min, sum, value, date and year are reserved. Ordinary field names such as
level, name, type, path, service, host and user are not.
Window by time
To see how an aggregate changes over time, add a time window under the grouping expressions. Every result row then carries a window_start and a window_end column, and the other grouping keys and aggregates are computed per window. The analysis is sorted by window_start descending, so the newest window leads.
| Kind | Meaning |
|---|---|
| Tumbling | Fixed windows that do not overlap. A 5 minute window puts each log in exactly one bucket. |
| Sliding | Windows of one size that start every slide. A 5 minute window sliding every 1 minute counts each log in five overlapping windows. The size must be a whole multiple of the slide, and a window can cover at most 100 slides. |
Each duration is a whole number of milliseconds, seconds, minutes, hours, or days. Windows bucket by event time by default; choose receive time to bucket by when Grepr received each log instead. The time range you searched selects logs by event time either way.
Windows are aligned to the clock rather than to the start of your time range, so the first and last windows of a range can be partial.
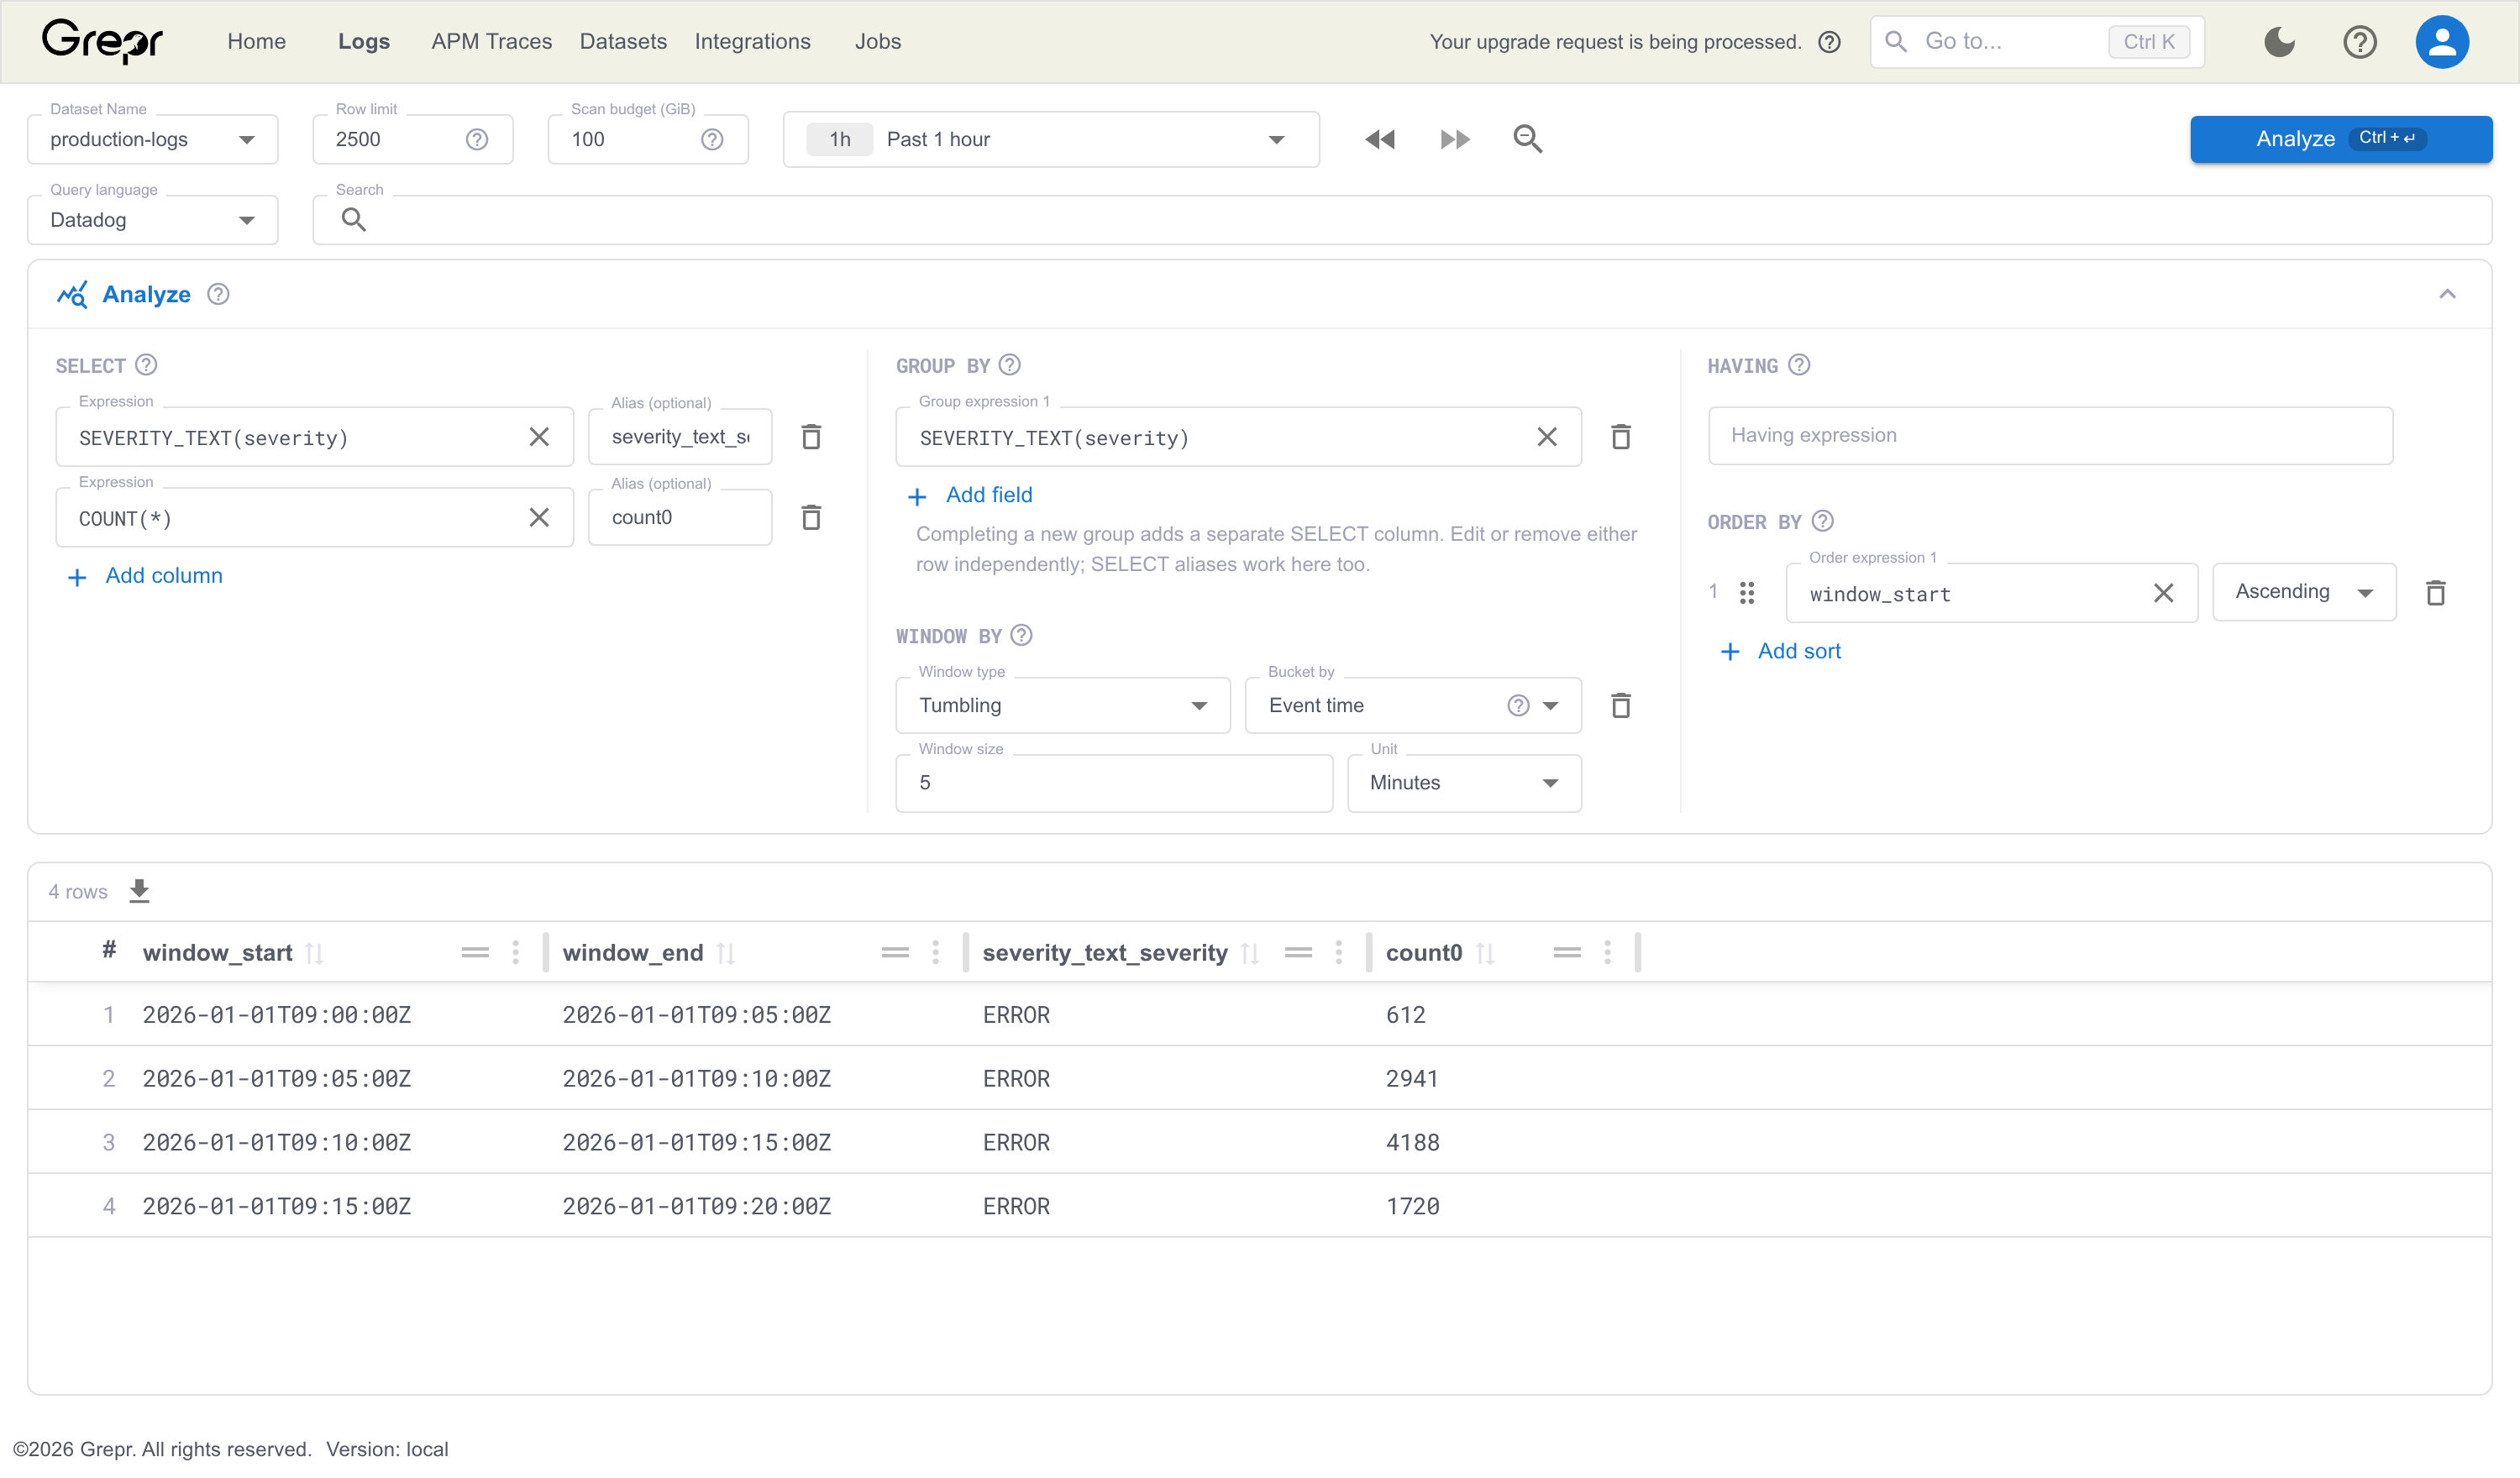
In the API, the window is the window object of the structured analytics query, with ISO-8601 durations:
{ "kind": "SLIDING", "timestamp": "EVENT_TIMESTAMP", "size": "PT5M", "slide": "PT1M" }Read the results table
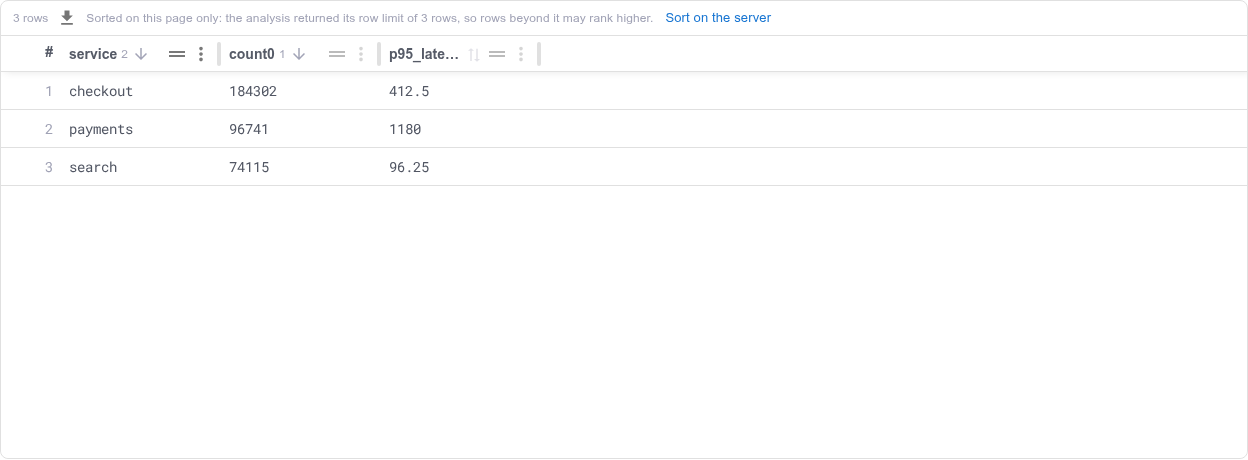
Click a column header to sort the rows you already have. No second run happens and no scan budget is spent; Shift-click adds a second sort instead of replacing the first.
When an analysis comes back at its row limit, the rows you have are only the top of the ranking, so sorting them on the page can put the wrong rows first. Sort on the server puts the sort into ORDER BY and runs the analysis again, so the engine ranks every matching row.
Share an analysis
The whole analysis lives in the page URL, so copying the link from the address bar is enough to share it. The link carries the dataset, the time range, the search query, every SELECT expression and its alias, every GROUP BY expression, the HAVING condition, the ORDER BY, the time window, the row limit, the scan budget, and the way you arranged the results table — its column order, column widths and sort.
Opening such a link seats every control and runs the analysis once, so the recipient sees the rows rather than a filled-in form waiting for a click. Back and Forward move between analyses you have already run, restoring the controls without re-running and spending scan budget again.
Result values
Each result row is a JSON object keyed by column name, so a column holds whatever the underlying attribute held, such as a number, a string, a boolean, or a nested object. Timestamps are returned as UTC ISO 8601 strings.
Limitations
- An analysis reads one dataset at a time. Joins across datasets are not supported.
- Sorting by an attribute that you have not cast sorts it by its stored text, so
100sorts before99. Cast the attribute to sort numerically, as inCAST(@http.status_code AS BIGINT). - A result alias cannot be a reserved SQL word, and a reference to one has to match its lowercase spelling exactly.
- A sort you set from the result headers sorts the rows already on the page. When the analysis returned its row limit, use Sort on the server to rank every matching row instead.
- An analysis too long to fit in the address bar cannot be shared as a link.
- An analysis can compute at most 128 values, group by at most 64 expressions, and sort by at most 64 expressions. Each expression can be at most 4,096 characters long.
- A time window’s size and slide are whole milliseconds, and a sliding window covers at most 100 slides.
window_startandwindow_endcannot be used as result aliases while a window is set. - Row, array, and map values are converted to nested JSON automatically. A value whose type has no JSON representation at all, or a constructed row with two fields of the same name, cannot be returned.