Query logs and traces with SQL
The SQL page runs one Grepr SQL query across the tables you set up for it. Each table reads a dataset’s logs or traces through a filter, under an alias that the query uses as a table name. Use SQL when one grouped SELECT can’t answer the question, such as when you join logs to other logs or to the spans of their traces, compare two filtered sets, aggregate an aggregate, or rank groups against each other. To aggregate logs with one SELECT and grouping, use Analyze mode instead. See Aggregate logs with Analyze mode.
Write and run a query
-
Click SQL in the top navigation.
-
In the top bar, select a dataset and a time range. The query reads every table from this one dataset and time range.
-
Set up the tables the query reads.
- Type is the kind of data the table reads: Logs or Traces. The menu lists the types the dataset holds.
- Alias is the table’s name in the query. An alias uses lowercase letters, numbers, and underscores, starts with a letter or an underscore, and can’t be a SQL keyword or the name of one of the table’s columns. Each table needs its own alias.
- The filter chooses the table’s logs or spans. A logs table’s filter is written as in Log Explorer’s search bar, in Datadog-like syntax or New Relic log query-like syntax. A traces table’s filter is written as in Trace Explorer’s search bar, in Datadog-like syntax. An empty filter reads every log or span in the time range.
To read the same logs through two filters, click Add table and give the new table its own alias and filter. A query reads at most four tables.
-
Write the query in the editor.
-
Click Run.
What a table contains
A table holds the dataset’s logs or spans whose event time is in the time range and that match the table’s filter. Every reference to an alias reads that same set, including inside a WITH query or either side of a join, so a query’s own WHERE can narrow a table but never widen it. Two tables can read the same logs through different filters, such as errors and all requests.
A table of logs has the log fields Analyze uses: id, received_timestamp, event_timestamp, tags, attributes, message, and severity. SELECT * returns those columns. Expressions follow the same rules as Analyze expressions, so tag accessors, @ attribute paths, and the Analyze functions mean the same thing in both.
To read an attribute of one table, put the table’s alias before the @, such as req.@request_id. A bare @request_id reads the attribute only when the query has one table. In a WITH query or a query in FROM that selects the attributes column, @ reads that column the same way.
What a traces table contains
A table of traces has one row per span, with these columns: received_timestamp, event_timestamp, servicename, resource, instrumentationscope, span, tracesignature, duration, haserror, percentilebucket, samplingtype, tracesignatureid, trace_id, span_id, trace_id_decimal, and attributes. duration is in nanoseconds. To learn what the columns from resource to samplingtype hold, see the COMPLETE_SPAN data type.
resource, instrumentationscope, and span are structs. Read a struct’s field with a dot, such as s.span.operationName or s.span.status.code. Field names are case-sensitive, so write them as the data type lists them. A query can return a struct’s fields but not the struct itself, so select the fields you need. The same holds for an array of structs, such as a span’s events: read an element’s fields, such as s.span.events[1].name. For the same reason, SELECT * over a traces table, which includes its structs, can’t run.
The trace and span IDs are text:
trace_idis the trace ID as 32 lowercase hexadecimal digits, andspan_idis the span ID as 16 lowercase hexadecimal digits, as Trace Explorer shows them.trace_id_decimalis the trace ID’s low 64 bits as an unsigned decimal number. Datadog writes a log’s trace ID in this form, asdd.trace_id.
attributes holds the span’s, the instrumentation scope’s, and the resource’s attributes as one set of keys with no levels, and @ reads it as it reads a logs table’s. s.@http.route reads the span’s http.route attribute. When the span has no such attribute, it reads the instrumentation scope’s, and then the resource’s. A key that the span or the instrumentation scope holds with a null value is read from there, so the read is null even when the resource has a value for the key.
A WITH query or a query in FROM that selects attributes, as SELECT * does, reads it with @ the same way, including across a join or a UNION ALL of traces tables. A query reads a traces table’s attributes only with @: it can’t return the column, pass it to a function, or read its fields. It can’t group, sort, or compare the column either, so a query that keeps it can’t use DISTINCT, UNION, INTERSECT, or EXCEPT over it. To combine the attributes of logs and traces in a UNION, read each key in its own branch, such as SELECT l.@env AS env FROM l UNION ALL SELECT s.@env AS env FROM s. To read one struct’s attributes with @, select them as attributes, such as SELECT s.resource.attributes AS attributes FROM s.
What a query can contain
A query is one read-only query, which can use:
- Expressions, WHERE, GROUP BY, HAVING, DISTINCT, ORDER BY, LIMIT, and OFFSET
- WITH queries, and queries in FROM
- Joins of the tables, including a table with itself: inner, left, right, full, and cross
- Window functions and aggregates over a window, each with its own OVER clause, and QUALIFY
- UNION, UNION ALL, INTERSECT, and EXCEPT, where every branch returns the same columns
- ROLLUP, CUBE, and GROUPING SETS, with GROUPING()
A query reads only its tables’ aliases and its own WITH queries, so a WITH query can’t take a table’s alias as its name. To use the result of one query inside another, join it, or define it as a WITH query and join that. An expression can’t contain a query, such as x IN (SELECT ...), EXISTS (...), or a single-value subquery. A query can’t use WITH RECURSIVE, VALUES, a separate WINDOW clause, or ? parameters.
Each result column needs its own name. Name an expression with AS. An expression you don’t name gets a generated name.
Examples
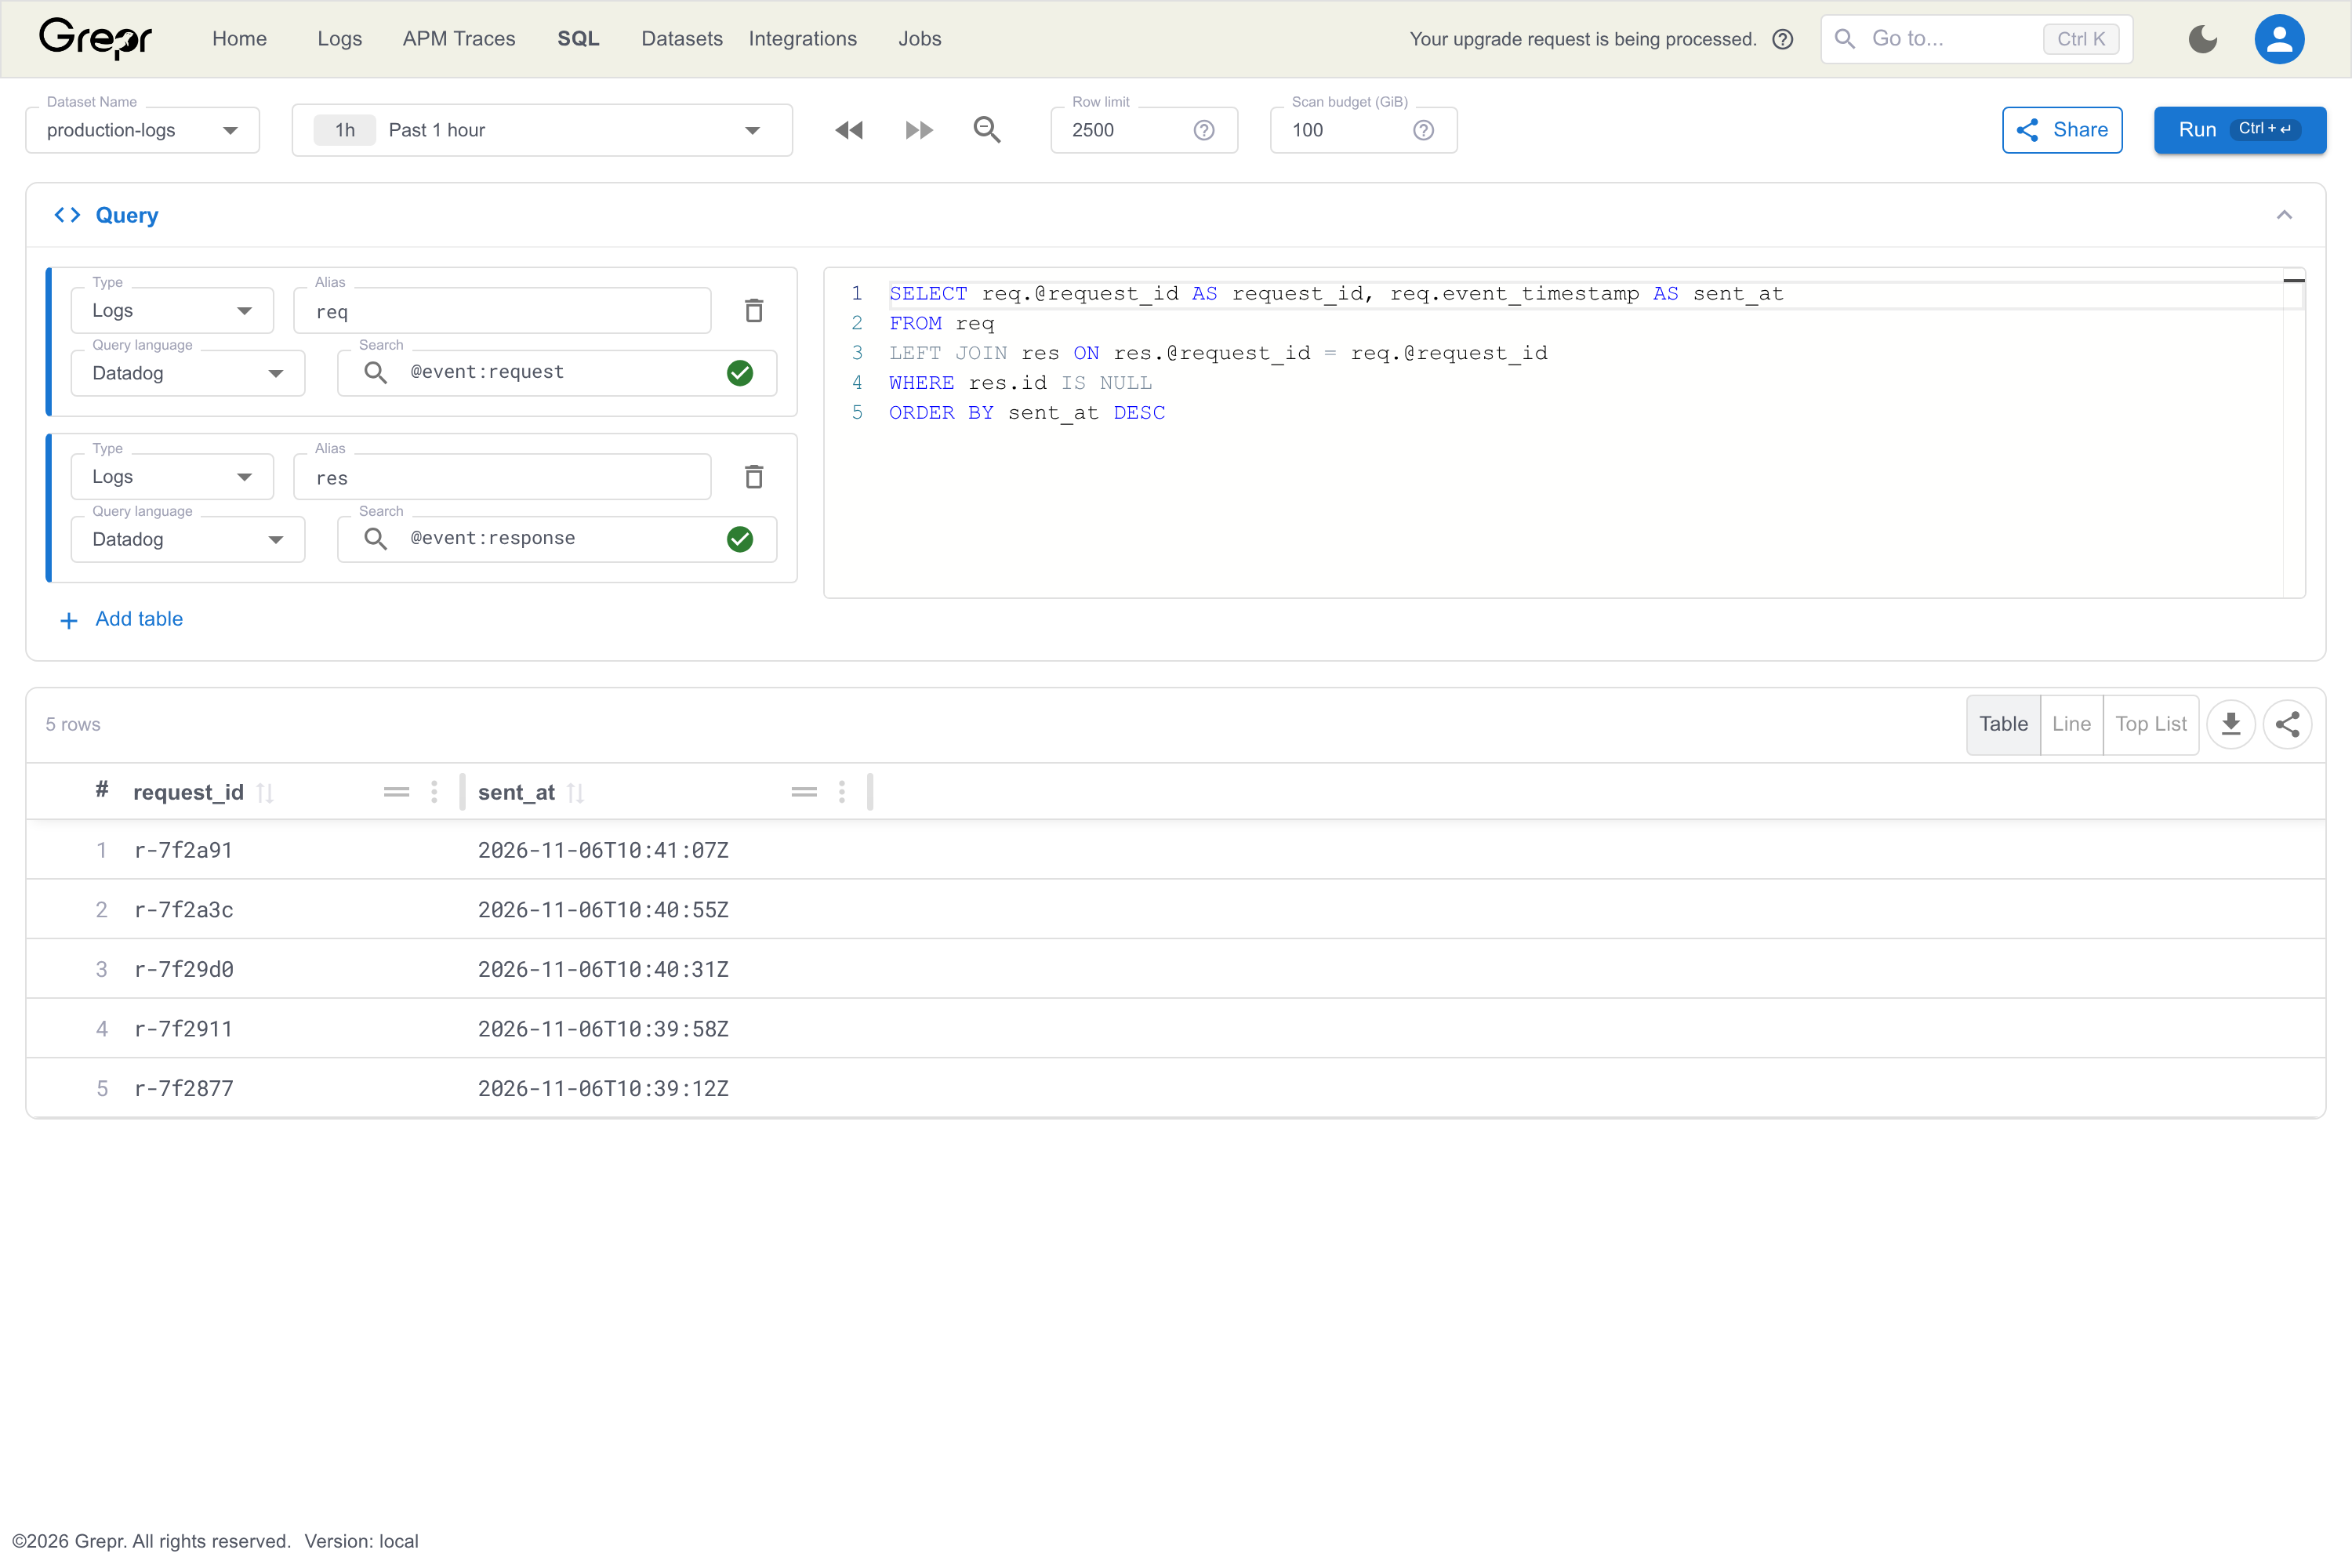
Find requests that got no response. Add two tables over the same logs: req with the filter @event:request, and res with the filter @event:response. Then join them:
SELECT req.@request_id AS request_id, req.event_timestamp AS sent_at
FROM req
LEFT JOIN res ON res.@request_id = req.@request_id
WHERE res.id IS NULL
ORDER BY sent_at DESC
Compare each service’s errors with its requests. Add a table requests with no filter and a table errors with the filter status:error, aggregate each, and join the aggregates:
WITH total AS (
  SELECT tags['service'][1] AS service, COUNT(*) AS requests
  FROM requests
  GROUP BY tags['service'][1]
),
failed AS (
  SELECT tags['service'][1] AS service, COUNT(*) AS errors
  FROM errors
  GROUP BY tags['service'][1]
)
SELECT total.service, total.requests, failed.errors,
       failed.errors * 100.0 / total.requests AS error_pct
FROM total
JOIN failed ON failed.service = total.service
ORDER BY error_pct DESC
Find the spans behind error logs. Add a table logs with the filter status:error and a traces table s. Logs that carry their trace ID in a trace_id tag join on trace_id when the tag is hexadecimal, as in OpenTelemetry logs, or on trace_id_decimal when it’s decimal, as in Datadog logs:
SELECT l.message, s.span.operationName AS operation, s.duration, s.@http.status_code AS status
FROM logs AS l
JOIN s ON l.tags['trace_id'][1] = s.trace_id
ORDER BY s.duration DESC
Rank services by their share of errors. With one table logs filtered on status:error, the WITH query aggregates once per service, and the outer query works on those rows:
WITH per_service AS (
  SELECT tags['service'][1] AS service,
         COUNT(*) AS errors,
         APPROX_PERCENTILE(@duration, 0.95) AS p95
  FROM logs
  GROUP BY tags['service'][1]
)
SELECT service, errors, p95,
       errors * 100.0 / SUM(errors) OVER () AS pct_of_errors,
       RANK() OVER (ORDER BY errors DESC) AS error_rank
FROM per_service
ORDER BY errors DESC
LIMIT 20
Rows and cost
The row limit in the top bar is the most rows a query returns. A LIMIT in the query can lower it but not raise it. When a result reaches the row limit, the rows beyond it aren’t on the page: raise the limit, or sort and limit in the query.
The scan budget covers every table a query reads, so a query that reads a table twice, such as a self-join, scans its time range twice. A shorter time range, or a table filter on service or host, scans less.
Chart a result
To draw a result, select Line or Top List above the results, or Table to see the rows.
- A line chart draws each numeric column over time, with one line per series. To draw one, group the outer query by a time bucket and by the columns that name each series, such as
FLOOR(event_timestamp TO MINUTE)and a service. A bucket is aSECOND,MINUTE,HOUR,DAY,WEEK,MONTH,QUARTER, orYEAR. - A top list draws one bar per row for each numeric column, named by the columns the outer query groups by, or by the row’s text columns when it has no GROUP BY. It needs a result without a time column.
When the outer query has no GROUP BY, such as a join of WITH queries, the result’s first timestamp column is the time, its text columns name the series, and its numeric columns are drawn. A query that uses ROLLUP, CUBE, or GROUPING SETS anywhere, including in a WITH query, shows its result as a table.
For example, to chart errors per service each minute, add a table errors with the filter status:error, and run:
SELECT FLOOR(event_timestamp TO MINUTE) AS bucket,
       tags['service'][1] AS service,
       COUNT(*) AS errors
FROM errors
GROUP BY 1, 2
ORDER BY 1
Share a query
To share a query, click Share, or copy the link from the address bar. The link carries the dataset, the time range, the limits, each table with its alias and filter, the query, the results table’s arrangement, and the chart. A link holds at most 8,000 characters, so a query too long to fit is left out of the link.
Limitations
- A query reads one dataset, and only its tables’ aliases.
- A query reads at most 4 tables, refers to them at most 4 times, joins at most 4 times, and contains at most 16 WITH queries.
- A query can be at most 32,768 characters long.
- A window’s PARTITION BY and ORDER BY can hold at most 16 expressions together, and a query can have at most 16 grouping sets.
- A table reads logs or traces.
- A query that reads a traces table can’t use
MAP_VALUESover a logs table’s attributes. To search every attribute value of a logs table, write the search in that table’s filter.